Current strength and record
includedStrength z-score, Record z-score
NBA by Numbers / Championship lab
From regular-season evidence to title probabilities.
Build the forecast. Test it honestly. Compare the price.
Current season · YTD snapshot
A probability for every NBA team, using season-to-date results. The model learns from historical snapshots at this same point in the calendar.
Refreshed 2026-11-10. Published snapshot; forecasts do not update automatically. Training uses 19 earlier seasons through 2026. This model uses dated team and player features described below. Player-impact and participation measures are proxies, not EPM or injury reports.
Default chosen by lowest title log loss across 9 shared November 10 test seasons; this selection is exploratory.
| Team | Conf. | Games | Record | Win % | Adjusted strength | Win championship | 80% range | 95% range |
|---|---|---|---|---|---|---|---|---|
| San Antonio Spurs | West | 11 | 9–2 | 81.8% | +6.1 | 19.9% | 11.7%–32.3% | 9.1%–40.9% |
| Los Angeles Lakers | West | 12 | 10–2 | 83.3% | +4.5 | 11.2% | 4.4%–19.1% | 2.7%–24.0% |
| Oklahoma City Thunder | West | 10 | 8–2 | 80.0% | +4.6 | 10.5% | 4.7%–19.5% | 3.0%–26.8% |
| Golden State Warriors | West | 11 | 8–3 | 72.7% | +4.8 | 8.2% | 4.3%–10.6% | 3.2%–12.1% |
| Denver Nuggets | West | 9 | 5–4 | 55.6% | +0.8 | 7.7% | 4.6%–11.0% | 3.7%–13.3% |
| Boston Celtics | East | 10 | 8–2 | 80.0% | +3.8 | 7.6% | 3.4%–11.8% | 2.3%–15.7% |
| Houston Rockets | West | 11 | 8–3 | 72.7% | +5.6 | 7.3% | 4.7%–9.4% | 3.9%–10.9% |
| New York Knicks | East | 9 | 5–4 | 55.6% | +1.9 | 4.4% | 2.3%–7.5% | 1.6%–10.4% |
| Detroit Pistons | East | 10 | 7–3 | 70.0% | +3.5 | 4.3% | 2.8%–5.2% | 2.4%–5.8% |
| Minnesota Timberwolves | West | 11 | 8–3 | 72.7% | +5.8 | 4.0% | 2.5%–5.2% | 2.1%–6.5% |
| Miami Heat | East | 10 | 4–6 | 40.0% | -2.2 | 3.0% | 1.2%–5.3% | 0.8%–6.8% |
| Memphis Grizzlies | West | 10 | 7–3 | 70.0% | +3.0 | 2.9% | 1.7%–4.0% | 1.3%–4.8% |
| Portland Trail Blazers | West | 9 | 6–3 | 66.7% | +3.1 | 2.1% | 1.0%–3.3% | 0.7%–4.0% |
| Atlanta Hawks | East | 12 | 7–5 | 58.3% | +0.6 | 1.8% | 0.9%–2.8% | 0.6%–3.6% |
| Cleveland Cavaliers | East | 11 | 5–6 | 45.5% | +0.7 | 1.7% | 0.9%–3.1% | 0.6%–4.1% |
| Dallas Mavericks | West | 11 | 7–4 | 63.6% | +2.5 | 0.8% | 0.5%–1.2% | 0.4%–1.6% |
| Philadelphia 76ers | East | 11 | 9–2 | 81.8% | +0.8 | 0.8% | 0.4%–1.2% | 0.3%–1.5% |
| Toronto Raptors | East | 10 | 5–5 | 50.0% | +1.2 | 0.3% | 0.1%–0.6% | <0.1%–0.9% |
| Charlotte Hornets | East | 11 | 4–7 | 36.4% | -6.5 | 0.2% | <0.1%–0.9% | <0.1%–1.7% |
| LA Clippers | West | 9 | 2–7 | 22.2% | -1.2 | 0.2% | 0.1%–0.4% | <0.1%–0.5% |
| Orlando Magic | East | 9 | 2–7 | 22.2% | -3.6 | 0.2% | <0.1%–0.3% | <0.1%–0.4% |
| Phoenix Suns | West | 9 | 3–6 | 33.3% | -2.7 | 0.2% | <0.1%–0.3% | <0.1%–0.4% |
| New Orleans Pelicans | West | 11 | 4–7 | 36.4% | -2.7 | 0.1% | <0.1%–0.2% | <0.1%–0.3% |
| Milwaukee Bucks | East | 10 | 1–9 | 10.0% | -6.3 | 0.1% | <0.1%–0.3% | <0.1%–0.4% |
| Indiana Pacers | East | 11 | 3–8 | 27.3% | -2.3 | 0.1% | <0.1%–0.2% | <0.1%–0.3% |
| Brooklyn Nets | East | 10 | 2–8 | 20.0% | -4.6 | 0.1% | <0.1%–0.2% | <0.1%–0.3% |
| Washington Wizards | East | 11 | 4–7 | 36.4% | -3.5 | <0.1% | <0.1%–0.2% | <0.1%–0.3% |
| Sacramento Kings | West | 10 | 1–9 | 10.0% | -5.5 | <0.1% | <0.1%–0.1% | <0.1%–0.2% |
| Utah Jazz | West | 10 | 1–9 | 10.0% | -4.4 | <0.1% | <0.1%–<0.1% | <0.1%–0.1% |
| Chicago Bulls | East | 9 | 1–8 | 11.1% | -7.4 | <0.1% | <0.1%–<0.1% | <0.1%–<0.1% |
Adjusted strength is opponent-adjusted scoring margin in points per game, estimated from these YTD games. Conference filters do not renormalize title probabilities. This is a direct title forecast; projected wins, playoff seeds, and round-by-round chances require a remaining-season simulator.
Approximate coefficient-uncertainty bands from 512 season-level Bayesian bootstrap refits, holding the as-of inputs, model, and ridge penalty fixed. They exclude input, roster, and model-selection uncertainty; coverage of the true title probability has not been established. A dash means no interval is available for this model.
28 forward test seasons. Lower log loss and Brier score are better. This table preserves the original baseline cohort. The default prediction uses the lowest matched-date forward title log loss among available models on the common advanced-feature test cohort reported below. Reusing historical comparisons for selection is exploratory; the lowest observed loss is not proof of a dependable improvement. Historical model defaults use only seasons before the selected forecast year.
| Model | Title log loss | Brier | Top-pick accuracy |
|---|---|---|---|
| Equal chances · all teams | 3.388 | 0.966 | 3.4% |
| Record softmax | 2.536 | 0.893 | 18.8% |
| Strength softmax | 2.564 | 0.881 | 32.1% |
| Strength + record softmax | 2.469 | 0.880 | 21.4% |
Advanced feature research
Compare team efficiency, style, player proxies, and earlier-season evidence on the same historical test seasons. Each model fits and tunes on earlier seasons; current-source coverage determines which models can produce today’s forecast.
2014–2026
Player-impact features here are box-score proxies, not EPM. Recent missed appearances describe observed participation; they are not historical injury reports or a forecast of availability.
This common cohort contains only 9 independent championship outcomes. Feature rankings and differences are particularly uncertain; additional models and checkpoints do not create additional independent champions.
Lower title log loss and Brier score are better. Compare these rows with each other; scores from longer or different historical cohorts are not directly comparable. Top-pick accuracy measures how often the highest-probability team won.
| Model | Title log loss | Brier | Top-pick accuracy |
|---|---|---|---|
All verified feature groups Current strength and record + Adjusted offense and defense + Previous season and roster continuity + Player box production and recent rotation + Shooting, turnovers, rebounding and free throws + Pace and three-point profile | 1.862 | 0.755 | 55.6% |
Full model without Adjusted offense and defense Current strength and record + Previous season and roster continuity + Player box production and recent rotation + Shooting, turnovers, rebounding and free throws + Pace and three-point profile | 1.872 | 0.750 | 55.6% |
Full model without Pace and three-point profile Current strength and record + Adjusted offense and defense + Previous season and roster continuity + Player box production and recent rotation + Shooting, turnovers, rebounding and free throws | 1.877 | 0.781 | 55.6% |
Full model without Previous season and roster continuity Current strength and record + Adjusted offense and defense + Player box production and recent rotation + Shooting, turnovers, rebounding and free throws + Pace and three-point profile | 1.897 | 0.753 | 55.6% |
Full model without Shooting, turnovers, rebounding and free throws Current strength and record + Adjusted offense and defense + Previous season and roster continuity + Player box production and recent rotation + Pace and three-point profile | 1.911 | 0.780 | 55.6% |
Baseline + Shooting, turnovers, rebounding and free throws Current strength and record + Shooting, turnovers, rebounding and free throws | 1.921 | 0.759 | 33.3% |
Full model without Player box production and recent rotation Current strength and record + Adjusted offense and defense + Previous season and roster continuity + Shooting, turnovers, rebounding and free throws + Pace and three-point profile | 1.992 | 0.771 | 33.3% |
Baseline + Player box production and recent rotation Current strength and record + Player box production and recent rotation | 2.010 | 0.848 | 55.6% |
Past-only model selector Baseline | 2.010 | 0.848 | 55.6% |
Baseline + Pace and three-point profile Current strength and record + Pace and three-point profile | 2.167 | 0.852 | 33.3% |
Baseline + Previous season and roster continuity Current strength and record + Previous season and roster continuity | 2.237 | 0.852 | 33.3% |
Strength + record · common training cohort Current strength and record | 2.296 | 0.924 | 11.1% |
Baseline + Adjusted offense and defense Current strength and record + Adjusted offense and defense | 2.300 | 0.910 | 22.2% |
Record · common training cohort Current strength and record | 2.307 | 0.924 | 11.1% |
Strength + record softmax · frozen longer-history forecast Current strength and record | 2.316 | 0.879 | 11.1% |
Record softmax · frozen longer-history forecast Current strength and record | 2.371 | 0.894 | 11.1% |
Strength · common training cohort Current strength and record | 2.441 | 0.865 | 44.4% |
Strength softmax · frozen longer-history forecast Current strength and record | 2.452 | 0.863 | 44.4% |
Equal chances · all teams · frozen longer-history forecast Current strength and record | 3.401 | 0.967 | 3.3% |
Title log loss, compared on each checkpoint’s common test years. The lowest fixed-model score is a retrospective comparison; the past-only selector chooses a model before each season’s outcome.
| Cutoff | Test seasons | Original strength + record | Lowest fixed-model loss | Past-only selector |
|---|---|---|---|---|
November 10 | 9 2014–2026 | 2.316 | 1.862 All verified feature groups | 2.010 |
January 1 Only 14 verified historical snapshots; the fixed protocol requires at least 15 before fitting this experiment. | 0 | — | — | — |
February 1 | 6 2016–2026 | 2.379 | 1.829 Full model without Previous season and roster continuity | 2.931 |
March 1 | 7 2012–2026 | 2.222 | 2.013 Baseline + Player box production and recent rotation | 2.246 |
Coverage can differ by checkpoint. An unavailable row is not a zero-error result. Complete checkpoint model and feature-group comparisons are included in the downloadable experiment.
Negative loss differences favor the challenger. If the interval crosses zero, the direction remains uncertain. These are exploratory comparisons on reused history.
| Comparison | Δ title log loss | 95% season interval |
|---|---|---|
| Equal chances · all teams · frozen longer-history forecast vs Strength + record softmax · frozen longer-history forecast | +1.085 | [+0.715, +1.456] |
| Record softmax · frozen longer-history forecast vs Strength + record softmax · frozen longer-history forecast | +0.055 | [-0.209, +0.321] |
| Strength softmax · frozen longer-history forecast vs Strength + record softmax · frozen longer-history forecast | +0.136 | [-0.156, +0.413] |
| Record · common training cohort vs Strength + record softmax · frozen longer-history forecast | -0.009 | [-0.281, +0.281] |
| Strength · common training cohort vs Strength + record softmax · frozen longer-history forecast | +0.125 | [-0.204, +0.446] |
| Strength + record · common training cohort vs Strength + record softmax · frozen longer-history forecast | -0.020 | [-0.194, +0.168] |
| All verified feature groups vs Strength + record softmax · frozen longer-history forecast | -0.454 | [-1.129, +0.274] |
| Baseline + Adjusted offense and defense vs Strength + record softmax · frozen longer-history forecast | -0.016 | [-0.198, +0.170] |
| Full model without Adjusted offense and defense vs Strength + record softmax · frozen longer-history forecast | -0.444 | [-1.155, +0.287] |
| Baseline + Previous season and roster continuity vs Strength + record softmax · frozen longer-history forecast | -0.079 | [-0.366, +0.212] |
| Full model without Previous season and roster continuity vs Strength + record softmax · frozen longer-history forecast | -0.419 | [-1.088, +0.196] |
| Baseline + Player box production and recent rotation vs Strength + record softmax · frozen longer-history forecast | -0.307 | [-1.106, +0.439] |
| Full model without Player box production and recent rotation vs Strength + record softmax · frozen longer-history forecast | -0.324 | [-0.745, +0.137] |
| Baseline + Shooting, turnovers, rebounding and free throws vs Strength + record softmax · frozen longer-history forecast | -0.395 | [-0.901, +0.129] |
| Full model without Shooting, turnovers, rebounding and free throws vs Strength + record softmax · frozen longer-history forecast | -0.405 | [-0.983, +0.241] |
| Baseline + Pace and three-point profile vs Strength + record softmax · frozen longer-history forecast | -0.149 | [-0.521, +0.234] |
| Full model without Pace and three-point profile vs Strength + record softmax · frozen longer-history forecast | -0.439 | [-1.058, +0.204] |
| Past-only model selector vs Strength + record softmax · frozen longer-history forecast | -0.307 | [-1.106, +0.439] |
Remove one group and refit. A positive change means removing it worsened the forecast. Groups overlap, so these are contributions within this model, not causal rankings or a guarantee that a statistic helps.
| Group removed | Δ title log loss | 95% season interval |
|---|---|---|
Player box production and recent rotation From All verified feature groups | +0.130 | [-0.201, +0.491] |
Shooting, turnovers, rebounding and free throws From All verified feature groups | +0.049 | [-0.213, +0.255] |
Previous season and roster continuity From All verified feature groups | +0.035 | [-0.164, +0.217] |
Pace and three-point profile From All verified feature groups | +0.015 | [-0.091, +0.114] |
Adjusted offense and defense From All verified feature groups | +0.010 | [-0.052, +0.070] |
Strength z-score, Record z-score
Adjusted ORTG, Adjusted DRTG
Prior-season adjusted net rating, Roster continuity
Rotation box production, Top rotation player's box production, Recent minutes continuity
Effective FG%, Opponent effective FG%, Turnovers per possession, Opponent turnovers per possession, Offensive rebound%, Defensive rebound%, Free-throw attempt rate, Opponent free-throw attempt rate
Estimated pace, Three-point attempt share, Three-point accuracy, Opponent three-point attempt share, Opponent three-point accuracy
This table includes context statistics as well as model inputs. The feature groups above identify fitted inputs; league ranks and raw ratings are included for interpretation.
| Team | ORTG | Offensive rank | DRTG | Defensive rank | Adjusted ORTG | Adjusted DRTG | Adjusted net rating | Estimated pace | Pace rank | Pace game coverage | 3PM / game | Record z-score | Strength z-score | Prior-season adjusted net rating | Roster continuity | Rotation box production | Top rotation player's box production | Recent minutes continuity | Effective FG% | Opponent effective FG% | Turnovers per possession | Opponent turnovers per possession | Offensive rebound% | Defensive rebound% | Free-throw attempt rate | Opponent free-throw attempt rate | Three-point attempt share | Three-point accuracy | Opponent three-point attempt share | Opponent three-point accuracy |
|---|---|---|---|---|---|---|---|---|---|---|---|---|---|---|---|---|---|---|---|---|---|---|---|---|---|---|---|---|---|---|
| Atlanta Hawks | 112.02 | 13 | 110.04 | 13 | 110.97 | 110.39 | +0.58 | 105.56 | 2 | 100.0% | 15.33 | +0.37 | +0.14 | +2.03 | 56.6% | 19.84 | 27.48 | 90.7% | 53.3% | 55.3% | 14.3% | 17.4% | 29.2% | 72.6% | 21.2% | 30.3% | 45.2% | 35.2% | 39.8% | 33.5% |
| Boston Celtics | 115.51 | 5 | 104.76 | 5 | 112.22 | 108.42 | +3.80 | 98.53 | 30 | 100.0% | 15.60 | +1.25 | +0.94 | +6.76 | 82.1% | 20.24 | 25.25 | 91.0% | 54.3% | 51.0% | 15.0% | 17.2% | 31.8% | 69.9% | 28.7% | 26.7% | 47.2% | 37.6% | 51.2% | 33.8% |
| Brooklyn Nets | 103.31 | 28 | 112.02 | 20 | 106.96 | 111.40 | -4.44 | 102.22 | 17 | 100.0% | 13.80 | -1.19 | -1.14 | -8.69 | 64.8% | 19.65 | 24.56 | 79.5% | 51.3% | 54.8% | 17.5% | 16.1% | 25.5% | 74.9% | 33.5% | 33.3% | 48.0% | 34.4% | 48.3% | 34.8% |
| Charlotte Hornets | 100.17 | 30 | 111.87 | 19 | 105.10 | 111.67 | -6.56 | 98.65 | 29 | 100.0% | 13.73 | -0.52 | -1.62 | +4.08 | 47.8% | 18.80 | 22.28 | 72.8% | 47.9% | 56.3% | 19.4% | 14.7% | 32.4% | 77.7% | 21.3% | 27.5% | 51.2% | 30.8% | 43.0% | 40.8% |
| Chicago Bulls | 104.95 | 26 | 120.47 | 30 | 108.40 | 115.29 | -6.89 | 107.35 | 1 | 100.0% | 11.44 | -1.55 | -1.85 | -4.32 | 65.0% | 20.11 | 24.24 | 82.0% | 48.7% | 56.5% | 15.0% | 13.9% | 28.0% | 67.2% | 35.7% | 33.1% | 46.4% | 27.2% | 40.3% | 39.5% |
| Cleveland Cavaliers | 112.52 | 10 | 111.03 | 16 | 112.10 | 111.55 | +0.54 | 102.60 | 12 | 100.0% | 15.27 | -0.15 | +0.16 | +3.26 | 64.0% | 21.66 | 26.29 | 75.5% | 54.9% | 51.8% | 13.3% | 13.1% | 24.5% | 72.8% | 27.7% | 24.2% | 46.7% | 36.7% | 42.7% | 35.5% |
| Dallas Mavericks | 112.39 | 12 | 107.85 | 10 | 111.69 | 109.18 | +2.52 | 102.25 | 16 | 100.0% | 12.36 | +0.59 | +0.63 | -4.61 | 58.4% | 20.05 | 24.51 | 79.5% | 54.8% | 51.9% | 15.9% | 15.2% | 30.0% | 71.8% | 27.0% | 28.2% | 40.8% | 34.4% | 41.5% | 31.7% |
| Denver Nuggets | 113.41 | 9 | 112.63 | 21 | 111.68 | 111.04 | +0.64 | 98.98 | 28 | 100.0% | 11.22 | +0.26 | +0.20 | +4.37 | 72.2% | 22.17 | 36.73 | 85.7% | 54.7% | 54.0% | 14.1% | 15.0% | 24.5% | 70.8% | 31.4% | 20.2% | 37.8% | 35.2% | 43.9% | 34.9% |
| Detroit Pistons | 111.31 | 14 | 103.31 | 3 | 110.88 | 107.49 | +3.39 | 101.25 | 23 | 100.0% | 13.80 | +0.85 | +0.86 | +6.67 | 80.4% | 20.51 | 26.41 | 88.3% | 54.6% | 49.7% | 14.3% | 17.8% | 25.6% | 71.8% | 27.5% | 29.5% | 43.1% | 37.0% | 41.9% | 32.2% |
| Golden State Warriors | 117.41 | 2 | 108.45 | 11 | 113.72 | 108.95 | +4.77 | 101.56 | 22 | 100.0% | 16.45 | +0.96 | +1.18 | -0.32 | 68.5% | 20.81 | 27.42 | 87.0% | 57.2% | 52.7% | 16.1% | 16.8% | 29.8% | 72.3% | 30.4% | 27.2% | 47.3% | 40.3% | 42.7% | 34.0% |
| Houston Rockets | 115.51 | 6 | 106.41 | 8 | 113.42 | 107.85 | +5.57 | 99.95 | 26 | 100.0% | 12.82 | +0.96 | +1.38 | +4.38 | 75.3% | 20.69 | 26.50 | 86.9% | 55.0% | 52.4% | 15.3% | 15.7% | 31.6% | 73.1% | 28.6% | 23.8% | 39.5% | 37.5% | 42.7% | 31.3% |
| Indiana Pacers | 107.94 | 22 | 111.64 | 18 | 108.80 | 111.16 | -2.36 | 103.17 | 7 | 100.0% | 12.64 | -0.89 | -0.58 | -6.62 | 75.6% | 19.56 | 23.72 | 74.9% | 54.1% | 53.5% | 14.5% | 14.5% | 19.7% | 72.7% | 27.8% | 27.6% | 43.7% | 33.5% | 43.3% | 35.9% |
| LA Clippers | 108.94 | 20 | 112.82 | 22 | 109.75 | 110.99 | -1.24 | 102.03 | 19 | 100.0% | 14.00 | -1.10 | -0.30 | +0.80 | 51.5% | 18.11 | 22.73 | 83.9% | 54.7% | 55.8% | 18.5% | 15.6% | 25.7% | 71.4% | 29.4% | 30.3% | 42.8% | 38.7% | 38.9% | 35.2% |
| Los Angeles Lakers | 118.80 | 1 | 111.34 | 17 | 114.89 | 110.57 | +4.33 | 102.76 | 10 | 100.0% | 14.00 | +1.39 | +1.11 | +1.46 | 41.1% | 21.37 | 32.48 | 86.0% | 59.2% | 54.5% | 16.4% | 18.1% | 27.9% | 68.7% | 36.7% | 32.1% | 44.2% | 38.4% | 47.3% | 37.6% |
| Memphis Grizzlies | 113.99 | 7 | 107.13 | 9 | 112.00 | 109.08 | +2.92 | 102.36 | 14 | 100.0% | 15.20 | +0.85 | +0.74 | -4.98 | 63.0% | 20.49 | 25.43 | 83.4% | 54.9% | 51.8% | 16.2% | 14.2% | 29.7% | 75.4% | 25.7% | 27.3% | 44.0% | 38.6% | 41.8% | 33.0% |
| Miami Heat | 109.08 | 19 | 114.08 | 25 | 110.00 | 112.05 | -2.05 | 105.06 | 3 | 100.0% | 13.50 | -0.37 | -0.55 | +1.89 | 56.3% | 21.13 | 33.16 | 84.5% | 54.3% | 58.0% | 14.7% | 16.4% | 22.9% | 74.6% | 28.0% | 24.6% | 44.2% | 34.0% | 46.4% | 39.4% |
| Milwaukee Bucks | 105.37 | 25 | 118.20 | 28 | 108.00 | 114.20 | -6.19 | 102.87 | 9 | 100.0% | 14.60 | -1.60 | -1.57 | -5.57 | 45.0% | 19.64 | 25.69 | 86.9% | 51.5% | 54.2% | 16.3% | 12.3% | 29.5% | 68.9% | 22.5% | 28.1% | 48.1% | 33.5% | 44.1% | 35.4% |
| Minnesota Timberwolves | 113.92 | 8 | 103.22 | 2 | 112.05 | 106.41 | +5.65 | 102.69 | 11 | 100.0% | 14.55 | +0.96 | +1.44 | +2.48 | 55.3% | 20.26 | 24.08 | 83.8% | 55.3% | 49.7% | 15.3% | 15.9% | 31.8% | 73.8% | 28.5% | 27.9% | 42.9% | 37.3% | 39.2% | 32.0% |
| New Orleans Pelicans | 110.56 | 16 | 115.18 | 26 | 110.29 | 113.21 | -2.92 | 103.30 | 6 | 100.0% | 9.09 | -0.52 | -0.68 | -3.83 | 86.6% | 20.18 | 25.19 | 84.8% | 52.8% | 56.1% | 15.6% | 15.3% | 24.7% | 72.9% | 35.7% | 32.0% | 32.3% | 32.5% | 44.3% | 33.9% |
| New York Knicks | 110.58 | 15 | 104.88 | 6 | 110.20 | 108.18 | +2.02 | 99.37 | 27 | 100.0% | 14.56 | +0.26 | +0.47 | +5.42 | 90.9% | 20.19 | 28.96 | 84.3% | 51.1% | 51.2% | 14.9% | 13.1% | 32.3% | 77.0% | 26.6% | 27.0% | 45.3% | 36.0% | 47.5% | 33.3% |
| Oklahoma City Thunder | 109.97 | 17 | 102.13 | 1 | 110.11 | 105.79 | +4.32 | 102.03 | 20 | 100.0% | 11.30 | +1.25 | +1.14 | +9.52 | 61.1% | 20.83 | 30.91 | 77.0% | 51.9% | 48.4% | 12.9% | 14.5% | 26.3% | 73.7% | 23.0% | 23.7% | 35.5% | 34.9% | 47.3% | 32.6% |
| Orlando Magic | 104.88 | 27 | 113.92 | 24 | 108.19 | 111.70 | -3.51 | 100.85 | 25 | 100.0% | 13.67 | -1.10 | -0.90 | +0.63 | 96.2% | 19.05 | 22.08 | 80.9% | 52.5% | 55.6% | 17.4% | 14.6% | 26.7% | 73.8% | 27.5% | 28.5% | 47.0% | 34.2% | 39.1% | 37.8% |
| Philadelphia 76ers | 108.28 | 21 | 105.27 | 7 | 108.99 | 108.18 | +0.81 | 102.51 | 13 | 100.0% | 11.55 | +1.33 | +0.21 | -0.21 | 48.0% | 21.07 | 25.94 | 88.0% | 51.1% | 51.0% | 12.6% | 15.6% | 22.6% | 73.3% | 29.2% | 29.8% | 38.1% | 34.0% | 41.0% | 31.6% |
| Phoenix Suns | 109.49 | 18 | 117.85 | 27 | 110.39 | 113.14 | -2.76 | 100.98 | 24 | 100.0% | 12.78 | -0.65 | -0.67 | +1.45 | 77.4% | 19.40 | 23.48 | 89.3% | 53.5% | 55.7% | 13.9% | 16.6% | 25.3% | 65.4% | 23.3% | 32.4% | 40.5% | 35.8% | 43.1% | 38.1% |
| Portland Trail Blazers | 115.88 | 3 | 110.48 | 14 | 112.84 | 109.78 | +3.07 | 102.98 | 8 | 100.0% | 15.11 | +0.71 | +0.76 | -0.16 | 76.9% | 20.30 | 27.15 | 87.7% | 56.2% | 51.5% | 16.4% | 13.7% | 29.5% | 73.8% | 37.2% | 32.1% | 49.8% | 35.6% | 42.2% | 32.2% |
| Sacramento Kings | 105.49 | 24 | 118.35 | 29 | 108.22 | 113.50 | -5.28 | 103.42 | 5 | 100.0% | 12.00 | -1.60 | -1.38 | -8.40 | 52.4% | 19.16 | 26.04 | 80.1% | 52.5% | 57.9% | 16.5% | 14.0% | 24.3% | 74.3% | 26.0% | 34.9% | 41.0% | 33.5% | 43.4% | 37.9% |
| San Antonio Spurs | 115.74 | 4 | 104.31 | 4 | 113.47 | 107.36 | +6.11 | 101.62 | 21 | 100.0% | 12.27 | +1.33 | +1.53 | +7.19 | 97.7% | 21.73 | 36.64 | 84.9% | 52.8% | 49.8% | 12.7% | 13.7% | 29.7% | 75.9% | 30.2% | 23.5% | 38.8% | 34.6% | 36.3% | 36.7% |
| Toronto Raptors | 112.51 | 11 | 109.33 | 12 | 111.08 | 110.29 | +0.79 | 103.63 | 4 | 100.0% | 11.20 | +0.03 | +0.30 | +2.19 | 88.2% | 19.60 | 24.80 | 77.6% | 52.0% | 55.6% | 14.0% | 19.3% | 32.6% | 71.5% | 29.9% | 36.6% | 38.1% | 31.8% | 42.5% | 36.5% |
| Utah Jazz | 101.67 | 29 | 112.87 | 23 | 106.43 | 110.67 | -4.25 | 102.32 | 15 | 100.0% | 11.50 | -1.60 | -1.10 | -6.85 | 59.6% | 19.25 | 23.54 | 86.7% | 49.5% | 52.4% | 16.7% | 14.6% | 25.8% | 74.5% | 28.9% | 35.8% | 40.9% | 32.1% | 39.1% | 35.7% |
| Washington Wizards | 105.75 | 23 | 110.90 | 15 | 107.72 | 111.09 | -3.37 | 102.22 | 18 | 100.0% | 9.45 | -0.52 | -0.86 | -10.02 | 58.5% | 19.73 | 26.59 | 77.1% | 51.4% | 51.2% | 14.6% | 13.9% | 22.9% | 69.4% | 29.5% | 21.0% | 37.3% | 29.6% | 42.0% | 31.3% |
ORTG: Points scored per 100 estimated possessions; displayed for interpretation.
Offensive rank: League rank of raw estimated offensive rating; 1 is best. Display only.
DRTG: Points allowed per 100 estimated possessions; lower is better.
Defensive rank: League rank of raw estimated defensive rating; 1 is best. Display only.
Adjusted ORTG: Points scored per100 estimated possessions after opponent and home-court adjustment; higher is better.
Adjusted DRTG: Points allowed per100 estimated possessions after opponent and home-court adjustment; lower is better.
Adjusted net rating: Adjusted offensive minus defensive rating; displayed for interpretation.
Estimated pace: Estimated possessions per48 minutes; overtime duration inferred from summed player minutes.
Pace rank: League pace rank; 1 is fastest, not necessarily best. Display only.
Pace game coverage: Share of observed team games with known duration used for pace; missing-duration games are excluded from both numerator and denominator.
3PM / game: Three-pointers made per game; displayed alongside the model's attempt-rate and accuracy inputs.
Record z-score: Existing cutoff win percentage standardized within the league.
Strength z-score: Existing score-only ridge strength, standardized within the cutoff league.
Prior-season adjusted net rating: Previous regular-season adjusted offense minus defense.
Roster continuity: Last5-game minutes weighted by each player's previous-season minutes share with this franchise.
Rotation box production: Recent rotation-weighted, shrunk box production per36; a counting-stat proxy, not EPM or adjusted player impact.
Top rotation player's box production: Highest shrunk production among players with at least4% of recent team minutes; not EPM.
Recent minutes continuity: Overlap of player minute shares in the last3 games and earlier games; participation proxy, not an injury report.
Effective FG%: (FGM+0.5*3PM)/FGA.
Opponent effective FG%: Opponent (FGM+0.5*3PM)/FGA.
Turnovers per possession: Team turnovers divided by estimated possessions.
Opponent turnovers per possession: Opponent turnovers divided by estimated possessions.
Offensive rebound%: ORB/(ORB+opponent DRB).
Defensive rebound%: DRB/(DRB+opponent ORB).
Free-throw attempt rate: FTA/FGA.
Opponent free-throw attempt rate: Opponent FTA/FGA.
Three-point attempt share: 3PA/FGA.
Three-point accuracy: 3PM/3PA before cutoff.
Opponent three-point attempt share: Opponent3PA/FGA.
Opponent three-point accuracy: Opponent3PM/3PA before cutoff.
NBA-by-Numbers uses modified SportsDataverse hoopR NBA data, sourced from ESPN, under CC BY 4.0. No endorsement implied. hoopR source · License
Additional model research
Compare stronger shrinkage, coefficient constraints, a compact feature set, and an ensemble on the same historical seasons. The experiment does not change the published forecast default.
Sensitivity bands, not validated confidence bounds. The 80% and 95% ranges describe variation under these modeling assumptions. They do not establish that the true title probability is covered at that rate.
Research comparison: the main forecast and market default remain unchanged. Stability is assessed separately from accuracy; these inspected historical cohorts do not establish a reliable replacement.
Lower log loss and Brier are better. Only 9 independent championship outcomes are in this cohort. Selecting the lowest observed score here remains exploratory.
| Model | Title log loss | Brier | Top-pick accuracy |
|---|---|---|---|
| All verified feature groups | 1.862 | 0.755 | 55.6% |
| Compact five-feature model | 1.959 | 0.795 | 44.4% |
| Past-only model selector | 2.010 | 0.848 | 55.6% |
| Full model · strong ridge + one-SE | 2.026 | 0.783 | 55.6% |
| Full model · directional bounds | 2.037 | 0.793 | 55.6% |
| Equal-weight stability ensemble | 2.058 | 0.804 | 55.6% |
| Strength + record · common training cohort | 2.296 | 0.924 | 11.1% |
| Strength + record softmax · frozen longer-history forecast | 2.316 | 0.879 | 11.1% |
| Record softmax · frozen longer-history forecast | 2.371 | 0.894 | 11.1% |
| Strength + record · strong ridge + one-SE | 2.441 | 0.881 | 11.1% |
| Strength softmax · frozen longer-history forecast | 2.452 | 0.863 | 44.4% |
| Equal chances · all teams · frozen longer-history forecast | 3.401 | 0.967 | 3.3% |
Negative loss differences favor the challenger. A 95% interval that crosses zero leaves the direction uncertain.
| Comparison | Δ title log loss | 95% season interval |
|---|---|---|
| Full model · strong ridge + one-SE vs All verified feature groups | +0.164 | [-0.127, +0.395] |
| Full model · strong ridge + one-SE vs Strength + record softmax · frozen longer-history forecast | -0.290 | [-0.756, +0.169] |
| Full model · directional bounds vs All verified feature groups | +0.175 | [-0.134, +0.433] |
| Full model · directional bounds vs Strength + record softmax · frozen longer-history forecast | -0.279 | [-0.725, +0.153] |
| Compact five-feature model vs All verified feature groups | +0.097 | [-0.322, +0.463] |
| Compact five-feature model vs Strength + record softmax · frozen longer-history forecast | -0.357 | [-0.896, +0.132] |
| Strength + record · strong ridge + one-SE vs All verified feature groups | +0.579 | [-0.145, +1.240] |
| Strength + record · strong ridge + one-SE vs Strength + record softmax · frozen longer-history forecast | +0.125 | [+0.028, +0.232] |
| Equal-weight stability ensemble vs All verified feature groups | +0.196 | [-0.211, +0.531] |
| Equal-weight stability ensemble vs Strength + record softmax · frozen longer-history forecast | -0.258 | [-0.660, +0.102] |
Equal-family sensitivity mixture with shared whole-season Bayesian-bootstrap refits
2026–27 · games before 2026-11-10. This selector explores the experiment only; it does not change the main forecast or market EV model.
Average probabilities from the four predeclared stability families; weights are not fitted.
Selected range: an equal-weight mixture across all four stability families and their refits. It includes coefficient variation, partial ridge-penalty reselection, and differences between the four model families.
2.9%
80% sensitivity: 1.3%–5.3%
95% sensitivity: 0.96%–5.81%
0.55%
80% sensitivity: 0.32%–1.18%
95% sensitivity: 0.23%–1.43%
| Team | Title probability | 80% sensitivity | 95% sensitivity | Across-model point range | Ensemble: model share of variance | Averaged ensemble refits: 95% |
|---|---|---|---|---|---|---|
| San Antonio Spurs | 18.3% | 9.8%–29.8% | 8.7%–34.0% | 10.1%–39.9% | 51.5% | 10.7%–24.6% |
| Los Angeles Lakers | 9.7% | 6.3%–12.7% | 4.7%–16.8% | 7.1%–16.5% | 2.9% | 6.3%–14.6% |
| Oklahoma City Thunder | 8.7% | 5.9%–11.3% | 4.8%–14.4% | 5.3%–10.5% | 6.1% | 5.8%–12.5% |
| Denver Nuggets | 6.7% | 2.4%–10.2% | 2.2%–12.8% | 1.7%–12.0% | 67.7% | 4.5%–9.9% |
| Houston Rockets | 6.6% | 5.0%–7.9% | 4.3%–8.6% | 3.3%–10.1% | 42.7% | 5.2%–7.9% |
| Golden State Warriors | 6.6% | 3.8%–8.8% | 3.1%–10.0% | 3.8%–8.2% | 59.2% | 4.6%–8.1% |
| Boston Celtics | 6.3% | 4.4%–7.7% | 3.5%–9.3% | 2.8%–9.1% | 14.6% | 4.5%–8.6% |
| Detroit Pistons | 5.1% | 4.1%–5.8% | 3.5%–6.4% | 2.3%–5.3% | 3.4% | 4.1%–5.9% |
| Minnesota Timberwolves | 5.0% | 2.8%–7.8% | 2.1%–8.4% | 1.5%–10.8% | 79.9% | 3.7%–6.3% |
| Portland Trail Blazers | 3.4% | 2.1%–4.6% | 1.7%–4.8% | 1.8%–4.5% | 46.2% | 2.5%–4.4% |
| New York Knicks | 3.4% | 2.5%–4.9% | 2.1%–6.1% | 1.1%–4.4% | 30.0% | 2.2%–5.0% |
| Memphis Grizzlies | 3.3% | 1.4%–4.9% | 0.97%–4.99% | 1.4%–5.0% | 81.4% | 2.5%–4.1% |
| Philadelphia 76ers | 2.9% | 1.3%–5.3% | 0.96%–5.81% | 0.76%–10.1% | 85.3% | 2.3%–4.0% |
| Miami Heat | 2.4% | 1.0%–4.0% | 0.84%–5.11% | 0.49%–3.1% | 52.3% | 1.5%–3.9% |
| Atlanta Hawks | 2.3% | 1.6%–3.1% | 1.4%–3.4% | 0.89%–2.6% | 11.5% | 1.7%–3.2% |
| Cleveland Cavaliers | 2.3% | 1.5%–3.7% | 1.2%–4.1% | 0.78%–2.9% | 37.1% | 1.5%–3.4% |
| Dallas Mavericks | 1.9% | 0.76%–3.92% | 0.53%–4.03% | 0.59%–3.9% | 84.6% | 1.5%–2.9% |
| Toronto Raptors | 1.1% | 0.54%–2.31% | 0.42%–2.55% | 0.21%–2.5% | 66.7% | 0.86%–2.01% |
| Phoenix Suns | 0.57% | 0.31%–1.22% | 0.23%–1.52% | 0.09%–0.84% | 10.0% | 0.35%–1.37% |
| New Orleans Pelicans | 0.55% | 0.32%–1.18% | 0.23%–1.43% | 0.14%–0.91% | 21.5% | 0.36%–1.29% |
| LA Clippers | 0.47% | 0.16%–1.03% | 0.10%–1.46% | 0.02%–1.2% | 22.8% | 0.30%–1.19% |
| Indiana Pacers | 0.42% | 0.12%–1.00% | 0.07%–1.38% | 0.05%–0.79% | 28.0% | 0.25%–1.13% |
| Orlando Magic | 0.38% | 0.15%–0.82% | 0.10%–1.41% | 0.02%–0.55% | 10.6% | 0.20%–1.15% |
| Washington Wizards | 0.38% | 0.14%–0.99% | 0.08%–1.25% | 0.06%–0.83% | 39.6% | 0.24%–1.06% |
| Charlotte Hornets | 0.31% | 0.11%–0.83% | 0.06%–1.18% | 0.02%–0.69% | 12.1% | 0.14%–1.01% |
| Brooklyn Nets | 0.29% | 0.09%–0.68% | 0.06%–1.07% | 0.04%–0.45% | 15.1% | 0.16%–0.85% |
| Milwaukee Bucks | 0.25% | 0.11%–0.63% | 0.07%–1.04% | 0.04%–0.30% | 5.9% | 0.11%–0.85% |
| Sacramento Kings | 0.19% | 0.07%–0.49% | 0.04%–0.86% | 0.02%–0.30% | 8.1% | 0.10%–0.68% |
| Utah Jazz | 0.19% | 0.08%–0.57% | 0.05%–0.83% | 0.03%–0.41% | 10.1% | 0.11%–0.70% |
| Chicago Bulls | 0.14% | 0.06%–0.49% | 0.04%–0.63% | 0.02%–0.24% | 8.2% | 0.07%–0.57% |
Showing Equal-weight stability ensemble. The point range compares model estimates; it is not an interval with calibrated coverage. The model share of variance always describes the equal-weight ensemble, regardless of the selected model; it is not a team’s chance of winning. The averaged-ensemble refit range varies coefficients and partially reselects ridge penalties while holding the four family weights fixed. It describes variation in the averaged prediction, whereas the broader ensemble sensitivity range also mixes across individual families. A dash means unavailable.
Leave one training season out and refit to measure current prediction shifts. One percentage point is a move from, for example, 10% to 11%. Coefficient scales depend on the standardized feature definition, so median coefficient SD is not a direct ranking across different feature sets.
| Model | Median coefficient SD | Mean leave-one-season-out shift | Max leave-one-season-out shift |
|---|---|---|---|
| All verified feature groups | 0.105 | 0.34 pp | 6.13 pp |
| Full model · strong ridge + one-SE | 0.061 | 0.20 pp | 3.47 pp |
| Full model · directional bounds | 0.061 | 0.19 pp | 3.24 pp |
| Compact five-feature model | 0.141 | 0.14 pp | 1.71 pp |
| Strength + record · strong ridge + one-SE | 0.121 | 0.06 pp | 0.46 pp |
| Equal-weight stability ensemble | — | 0.13 pp | 1.76 pp |
Sign fractions describe the resampled fits. A coefficient that changes sign can reflect correlated predictors or limited data; these diagnostics do not establish a statistic’s causal effect. Boundary fraction reports how often a constraint was active.
| Feature | Coefficient | 95% resampled range | Positive fits | Negative fits | At constraint |
|---|---|---|---|---|---|
| Strength z-score | +0.182 | [+0.055, +0.325] | 99.8% | 0.20% | — |
| Record z-score | +0.392 | [+0.204, +0.539] | 100.0% | 0.0% | — |
| Adjusted ORTG | -0.030 | [-0.148, +0.131] | 45.3% | 54.7% | — |
| Adjusted DRTG | -0.181 | [-0.298, -0.049] | 0.39% | 99.6% | — |
| Prior-season net rating | +0.405 | [+0.199, +0.606] | 100.0% | 0.0% | — |
| Retained minutes | +0.075 | [-0.156, +0.300] | 75.2% | 24.8% | — |
| Rotation box production | +0.337 | [+0.161, +0.504] | 100.0% | 0.0% | — |
| Star box production | +0.414 | [+0.180, +0.601] | 100.0% | 0.0% | — |
| Recent minutes continuity | +0.116 | [-0.119, +0.332] | 78.7% | 21.3% | — |
| eFG% | +0.325 | [+0.148, +0.453] | 100.0% | 0.0% | — |
| Opponent eFG% | -0.044 | [-0.230, +0.118] | 30.1% | 69.9% | — |
| Turnover rate | +0.213 | [-0.003, +0.420] | 97.1% | 2.9% | — |
| Opponent turnover rate | +0.040 | [-0.179, +0.199] | 59.2% | 40.8% | — |
| Offensive rebound % | +0.162 | [-0.122, +0.465] | 86.1% | 13.9% | — |
| Defensive rebound % | +0.168 | [-0.083, +0.432] | 89.1% | 10.9% | — |
| Free-throw rate | -0.214 | [-0.425, +0.032] | 6.3% | 93.8% | — |
| Opponent FT rate | -0.189 | [-0.333, -0.038] | 0.98% | 99.0% | — |
| Pace | +0.105 | [-0.136, +0.310] | 80.5% | 19.5% | — |
| 3PA rate | +0.046 | [-0.154, +0.278] | 69.1% | 30.9% | — |
| 3P% | +0.244 | [+0.011, +0.429] | 97.9% | 2.1% | — |
| Opponent 3PA rate | +0.138 | [-0.057, +0.308] | 91.8% | 8.2% | — |
| Opponent 3P% | +0.034 | [-0.184, +0.231] | 59.8% | 40.2% | — |
Sign fractions describe the resampled fits. A coefficient that changes sign can reflect correlated predictors or limited data; these diagnostics do not establish a statistic’s causal effect. Boundary fraction reports how often a constraint was active.
| Feature | Coefficient | 95% resampled range | Positive fits | Negative fits | At constraint |
|---|---|---|---|---|---|
| Strength z-score | +0.167 | [+0.085, +0.244] | 100.0% | 0.0% | — |
| Record z-score | +0.249 | [+0.110, +0.339] | 100.0% | 0.0% | — |
| Adjusted ORTG | +0.053 | [-0.027, +0.145] | 91.4% | 8.6% | — |
| Adjusted DRTG | -0.130 | [-0.208, -0.034] | 0.0% | 100.0% | — |
| Prior-season net rating | +0.239 | [+0.090, +0.391] | 100.0% | 0.0% | — |
| Retained minutes | +0.076 | [-0.042, +0.201] | 91.2% | 8.8% | — |
| Rotation box production | +0.253 | [+0.106, +0.385] | 100.0% | 0.0% | — |
| Star box production | +0.296 | [+0.110, +0.439] | 100.0% | 0.0% | — |
| Recent minutes continuity | +0.075 | [-0.035, +0.190] | 90.4% | 9.6% | — |
| eFG% | +0.230 | [+0.100, +0.320] | 100.0% | 0.0% | — |
| Opponent eFG% | -0.062 | [-0.150, +0.041] | 12.7% | 87.3% | — |
| Turnover rate | +0.114 | [-0.025, +0.236] | 92.2% | 7.8% | — |
| Opponent turnover rate | +0.036 | [-0.078, +0.141] | 69.3% | 30.7% | — |
| Offensive rebound % | +0.064 | [-0.090, +0.268] | 76.2% | 23.8% | — |
| Defensive rebound % | +0.099 | [-0.063, +0.252] | 88.7% | 11.3% | — |
| Free-throw rate | -0.105 | [-0.241, +0.047] | 8.8% | 91.2% | — |
| Opponent FT rate | -0.112 | [-0.203, -0.021] | 0.98% | 99.0% | — |
| Pace | +0.084 | [-0.032, +0.245] | 86.9% | 13.1% | — |
| 3PA rate | +0.041 | [-0.074, +0.165] | 77.7% | 22.3% | — |
| 3P% | +0.171 | [+0.035, +0.292] | 99.4% | 0.59% | — |
| Opponent 3PA rate | +0.074 | [-0.035, +0.167] | 86.3% | 13.7% | — |
| Opponent 3P% | -0.011 | [-0.126, +0.096] | 41.6% | 58.4% | — |
Sign fractions describe the resampled fits. A coefficient that changes sign can reflect correlated predictors or limited data; these diagnostics do not establish a statistic’s causal effect. Boundary fraction reports how often a constraint was active.
| Feature | Coefficient | 95% resampled range | Positive fits | Negative fits | At constraint |
|---|---|---|---|---|---|
| Strength z-score | +0.163 | [+0.075, +0.242] | 100.0% | 0.0% | 0.0% |
| Record z-score | +0.245 | [+0.104, +0.352] | 100.0% | 0.0% | 0.0% |
| Adjusted ORTG | +0.041 | [0.000, +0.138] | 85.4% | 0.0% | 14.6% |
| Adjusted DRTG | -0.136 | [-0.218, -0.030] | 0.0% | 99.8% | 0.20% |
| Prior-season net rating | +0.235 | [+0.079, +0.412] | 100.0% | 0.0% | 0.0% |
| Retained minutes | +0.072 | [-0.045, +0.202] | 89.5% | 10.5% | — |
| Rotation box production | +0.251 | [+0.105, +0.381] | 100.0% | 0.0% | — |
| Star box production | +0.294 | [+0.112, +0.463] | 100.0% | 0.0% | — |
| Recent minutes continuity | +0.075 | [-0.037, +0.193] | 89.6% | 10.4% | — |
| eFG% | +0.244 | [+0.102, +0.355] | 100.0% | 0.0% | 0.0% |
| Opponent eFG% | -0.066 | [-0.160, 0.000] | 0.0% | 87.3% | 12.7% |
| Turnover rate | 0.000 | [-0.025, 0.000] | 0.0% | 7.4% | 92.6% |
| Opponent turnover rate | +0.033 | [0.000, +0.146] | 68.0% | 0.0% | 32.0% |
| Offensive rebound % | +0.073 | [0.000, +0.276] | 79.1% | 0.0% | 20.9% |
| Defensive rebound % | +0.097 | [0.000, +0.254] | 88.1% | 0.0% | 11.9% |
| Free-throw rate | -0.097 | [-0.241, +0.051] | 10.5% | 89.5% | — |
| Opponent FT rate | -0.109 | [-0.207, -0.016] | 0.0% | 98.8% | 1.2% |
| Pace | +0.095 | [-0.032, +0.275] | 87.9% | 12.1% | — |
| 3PA rate | +0.042 | [-0.071, +0.158] | 78.3% | 21.7% | — |
| 3P% | +0.174 | [+0.034, +0.303] | 99.2% | 0.78% | — |
| Opponent 3PA rate | +0.073 | [-0.039, +0.167] | 86.7% | 13.3% | — |
| Opponent 3P% | -0.015 | [-0.123, +0.098] | 41.4% | 58.6% | — |
Sign fractions describe the resampled fits. A coefficient that changes sign can reflect correlated predictors or limited data; these diagnostics do not establish a statistic’s causal effect. Boundary fraction reports how often a constraint was active.
| Feature | Coefficient | 95% resampled range | Positive fits | Negative fits | At constraint |
|---|---|---|---|---|---|
| Adjusted Net | +0.352 | [+0.134, +0.581] | 99.8% | 0.0% | 0.20% |
| Record z-score | +0.536 | [+0.231, +0.724] | 100.0% | 0.0% | 0.0% |
| Prior-season net rating | +0.411 | [+0.105, +0.675] | 99.2% | 0.0% | 0.78% |
| Player Index | +0.624 | [+0.272, +0.892] | 100.0% | 0.0% | 0.0% |
| Recent minutes continuity | +0.150 | [-0.046, +0.355] | 91.0% | 9.0% | — |
Sign fractions describe the resampled fits. A coefficient that changes sign can reflect correlated predictors or limited data; these diagnostics do not establish a statistic’s causal effect. Boundary fraction reports how often a constraint was active.
| Feature | Coefficient | 95% resampled range | Positive fits | Negative fits | At constraint |
|---|---|---|---|---|---|
| Strength z-score | +0.537 | [+0.294, +0.793] | 100.0% | 0.0% | — |
| Record z-score | +0.675 | [+0.397, +0.846] | 100.0% | 0.0% | — |
Compare models within each checkpoint’s shared test years. Results from different dates can have different cohorts and are not additional independent championship outcomes.
| Model | Title log loss | Brier | Top-pick accuracy |
|---|---|---|---|
| All verified feature groups | 1.862 | 0.755 | 55.6% |
| Compact five-feature model | 1.959 | 0.795 | 44.4% |
| Past-only model selector | 2.010 | 0.848 | 55.6% |
| Full model · strong ridge + one-SE | 2.026 | 0.783 | 55.6% |
| Full model · directional bounds | 2.037 | 0.793 | 55.6% |
| Equal-weight stability ensemble | 2.058 | 0.804 | 55.6% |
| Strength + record · common training cohort | 2.296 | 0.924 | 11.1% |
| Strength + record softmax · frozen longer-history forecast | 2.316 | 0.879 | 11.1% |
| Record softmax · frozen longer-history forecast | 2.371 | 0.894 | 11.1% |
| Strength + record · strong ridge + one-SE | 2.441 | 0.881 | 11.1% |
| Strength softmax · frozen longer-history forecast | 2.452 | 0.863 | 44.4% |
| Equal chances · all teams · frozen longer-history forecast | 3.401 | 0.967 | 3.3% |
Only 14 verified historical snapshots; the fixed protocol requires at least 15 before fitting this experiment.
| Model | Title log loss | Brier | Top-pick accuracy |
|---|---|---|---|
| All verified feature groups | 1.929 | 0.812 | 33.3% |
| Full model · directional bounds | 2.188 | 0.850 | 33.3% |
| Full model · strong ridge + one-SE | 2.189 | 0.850 | 33.3% |
| Compact five-feature model | 2.251 | 0.852 | 50.0% |
| Equal-weight stability ensemble | 2.258 | 0.858 | 33.3% |
| Strength softmax · frozen longer-history forecast | 2.316 | 0.926 | 33.3% |
| Strength + record · common training cohort | 2.356 | 0.915 | 16.7% |
| Strength + record softmax · frozen longer-history forecast | 2.379 | 0.952 | 16.7% |
| Strength + record · strong ridge + one-SE | 2.471 | 0.892 | 16.7% |
| Record softmax · frozen longer-history forecast | 2.517 | 0.980 | 16.7% |
| Past-only model selector | 2.931 | 1.061 | 0.0% |
| Equal chances · all teams · frozen longer-history forecast | 3.401 | 0.967 | 3.3% |
| Model | Title log loss | Brier | Top-pick accuracy |
|---|---|---|---|
| Compact five-feature model | 2.107 | 0.821 | 57.1% |
| All verified feature groups | 2.152 | 0.854 | 14.3% |
| Strength softmax · frozen longer-history forecast | 2.154 | 0.903 | 28.6% |
| Strength + record · common training cohort | 2.199 | 0.876 | 28.6% |
| Strength + record softmax · frozen longer-history forecast | 2.222 | 0.934 | 28.6% |
| Equal-weight stability ensemble | 2.232 | 0.850 | 42.9% |
| Past-only model selector | 2.246 | 0.936 | 28.6% |
| Full model · directional bounds | 2.247 | 0.856 | 14.3% |
| Full model · strong ridge + one-SE | 2.259 | 0.859 | 14.3% |
| Record softmax · frozen longer-history forecast | 2.353 | 0.969 | 14.3% |
| Strength + record · strong ridge + one-SE | 2.407 | 0.880 | 28.6% |
| Equal chances · all teams · frozen longer-history forecast | 3.401 | 0.967 | 3.3% |
Historical snapshots · Original baseline forecasts
Pick a season and checkpoint to see what the model predicted using only games before that date. Each forecast was trained on earlier seasons. These archive probabilities use the original score-and-record models; advanced-feature checkpoint comparisons are reported separately.
Games before 2026-03-01 · trained through 2025. Eventual champion: NYK (4.3% forecast probability). The outcome is shown for evaluation only. Selected model: Strength softmax. Automatic selection uses only earlier evaluated seasons; the earliest snapshot falls back to strength + record.
| Team | Record at cutoff | Win championship | 80% range | 95% range |
|---|---|---|---|---|
| Oklahoma City Thunder | 46–15 | 51.7% | 44.5%–59.6% | 40.5%–64.5% |
| Detroit Pistons | 44–14 | 9.8% | 9.1%–10.1% | 8.5%–10.2% |
| Boston Celtics | 39–20 | 7.9% | 7.1%–8.4% | 6.5%–8.5% |
| San Antonio Spurs | 43–16 | 7.7% | 6.9%–8.2% | 6.3%–8.4% |
| New York Knicks | 38–22 | 4.3% | 3.6%–4.9% | 3.2%–5.2% |
| Houston Rockets | 37–22 | 3.8% | 3.1%–4.4% | 2.7%–4.7% |
| Cleveland Cavaliers | 37–24 | 2.7% | 2.1%–3.2% | 1.7%–3.5% |
| Denver Nuggets | 37–23 | 2.6% | 2.0%–3.1% | 1.7%–3.4% |
| Minnesota Timberwolves | 37–23 | 2.0% | 1.6%–2.5% | 1.3%–2.8% |
| Miami Heat | 32–29 | 1.5% | 1.1%–1.9% | 0.9%–2.2% |
| Charlotte Hornets | 30–31 | 1.2% | 0.9%–1.6% | 0.7%–1.8% |
| Toronto Raptors | 35–25 | 0.8% | 0.6%–1.2% | 0.4%–1.4% |
| Golden State Warriors | 31–29 | 0.8% | 0.5%–1.1% | 0.4%–1.3% |
| Phoenix Suns | 34–26 | 0.6% | 0.4%–0.9% | 0.3%–1.0% |
| Orlando Magic | 31–27 | 0.5% | 0.3%–0.7% | 0.2%–0.9% |
| Philadelphia 76ers | 33–26 | 0.5% | 0.3%–0.7% | 0.2%–0.8% |
| Los Angeles Lakers | 35–24 | 0.4% | 0.2%–0.6% | 0.2%–0.7% |
| LA Clippers | 27–31 | 0.4% | 0.2%–0.5% | 0.1%–0.7% |
| Atlanta Hawks | 30–31 | 0.3% | 0.2%–0.5% | 0.1%–0.6% |
| Portland Trail Blazers | 29–32 | 0.2% | <0.1%–0.3% | <0.1%–0.4% |
| Memphis Grizzlies | 22–36 | 0.1% | <0.1%–0.2% | <0.1%–0.3% |
| Milwaukee Bucks | 26–32 | <0.1% | <0.1%–0.2% | <0.1%–0.2% |
| Dallas Mavericks | 21–38 | <0.1% | <0.1%–0.1% | <0.1%–0.2% |
| Chicago Bulls | 24–36 | <0.1% | <0.1%–<0.1% | <0.1%–0.1% |
| New Orleans Pelicans | 19–42 | <0.1% | <0.1%–<0.1% | <0.1%–0.1% |
| Utah Jazz | 18–42 | <0.1% | <0.1%–<0.1% | <0.1%–<0.1% |
| Indiana Pacers | 15–45 | <0.1% | <0.1%–<0.1% | <0.1%–<0.1% |
| Brooklyn Nets | 15–44 | <0.1% | <0.1%–<0.1% | <0.1%–<0.1% |
| Sacramento Kings | 14–47 | <0.1% | <0.1%–<0.1% | <0.1%–<0.1% |
| Washington Wizards | 16–43 | <0.1% | <0.1%–<0.1% | <0.1%–<0.1% |
Approximate coefficient-uncertainty bands from 512 season-level Bayesian bootstrap refits, holding the as-of inputs, model, and ridge penalty fixed. They exclude input, roster, and model-selection uncertainty; coverage of the true title probability has not been established. A dash means no interval is available for this model.
All checkpoints exclude 2020. January and February 1999 are unavailable because the season had not started. This direct title model does not simulate the remaining schedule or bracket.
Experiment 02 · Same historical seasons
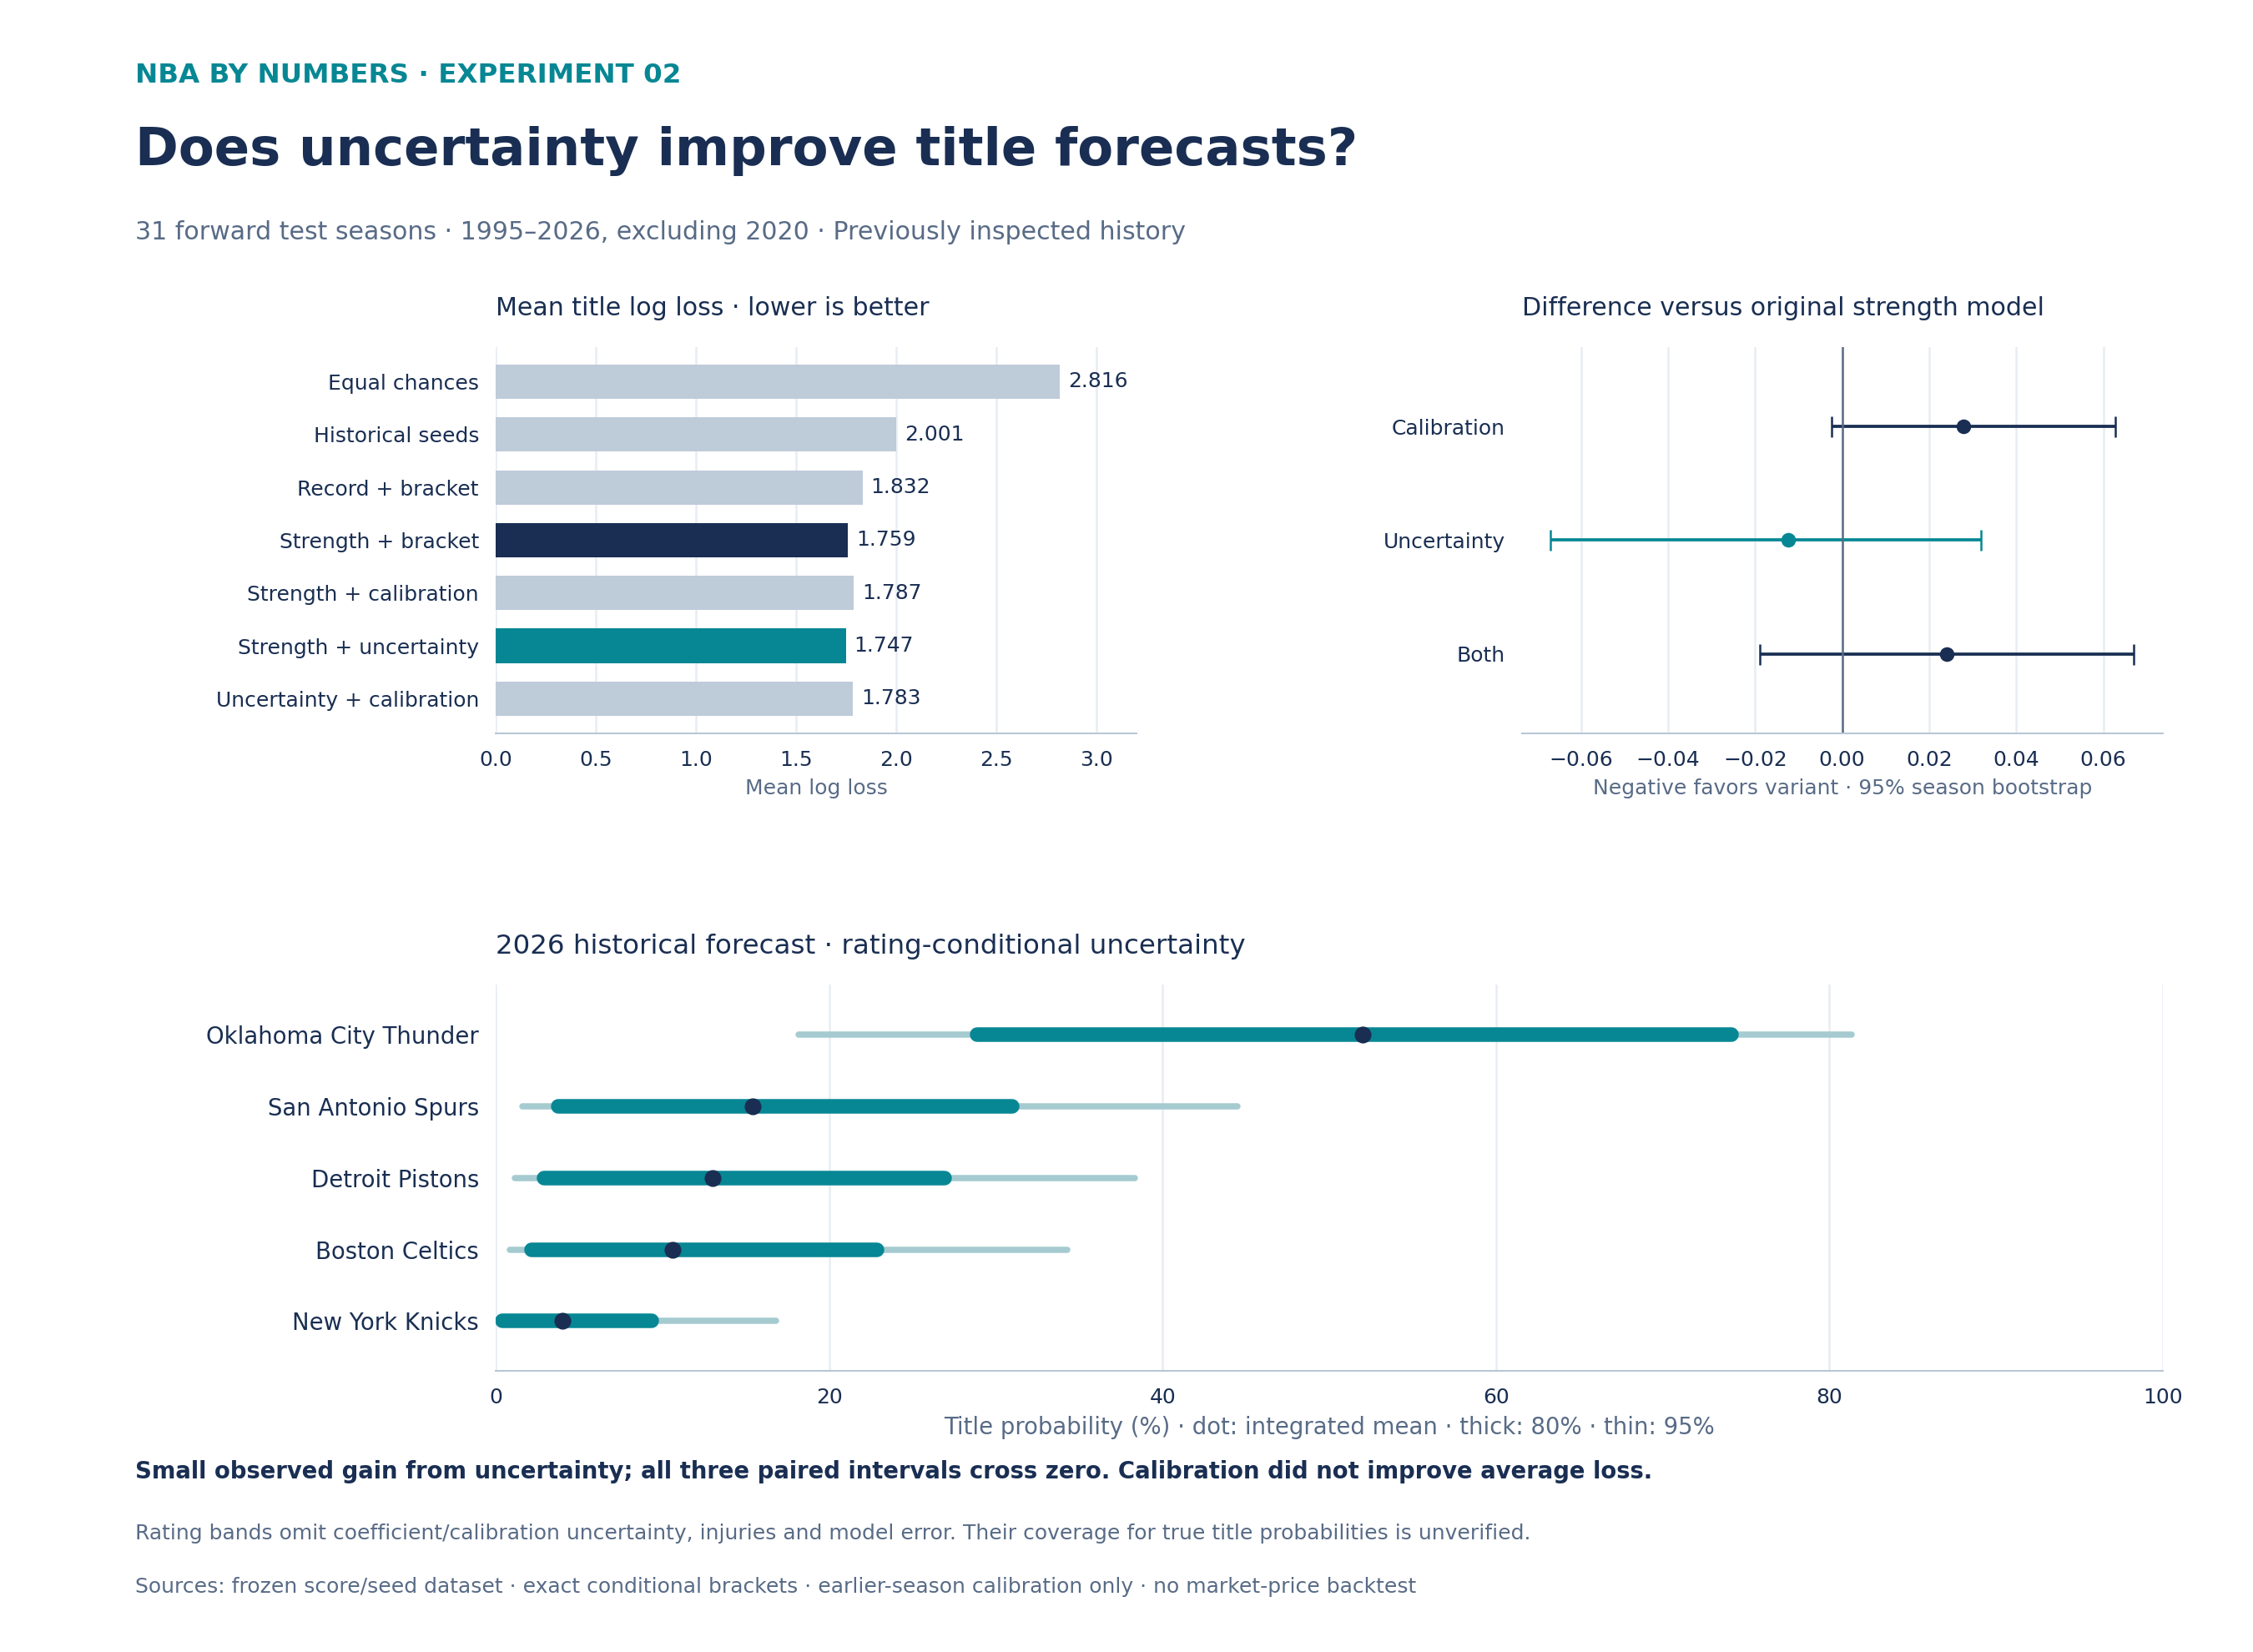
We kept the original strength + bracket model and three baselines, then tested temperature calibration, uncertainty in team strength, and both together. Each forecast still learns only from earlier seasons.
31
forward test seasons
1995–2026
season end years · 2020 excluded
7
models on the identical eligible field
Historical research, not current title odds. These experiments were designed after examining v1. Reusing the same seasons is an exploratory comparison, not a fresh holdout. The forecast cutoff is regular-season end, before any play-in games.
Lower log loss and Brier score mean better probability forecasts. Top-pick accuracy answers a different question.
| Model | Title log loss ↓ | Brier ↓ | Top-pick accuracy | Δ loss vs v1 |
|---|---|---|---|---|
Equal chances Every eligible team has the same title probability: 1/16 historically, 1/20 in play-in seasons. | 2.816 | 0.940 | 6.0% | +1.057 |
Historical seeds Earlier champions' conference seed frequencies, with 0.5 pseudocount per rank, normalized across the current field. | 2.001 | 0.824 | 27.4% | +0.242 |
Record + bracket Same trained game model and exact bracket, using regular-season win percentage instead of adjusted scoring margin. | 1.832 | 0.750 | 41.9% | +0.073 |
Strength + bracket Opponent-adjusted regular-season scoring margin, a game model fitted only on earlier playoffs, and exact bracket probabilities. | 1.759 | 0.727 | 38.7% | Reference |
Strength + calibration One title-level temperature fitted only on earlier forward forecasts; preserves team ranking. | 1.787 | 0.739 | 38.7% | +0.028 |
Strength + uncertainty Average exact brackets over 1,024 correlated rating draws; each draw persists through the whole postseason. Lowest observed log loss | 1.747 | 0.724 | 41.9% | -0.012 |
Uncertainty + calibration Apply a separately fitted past-only temperature to uncertainty-integrated title probabilities. | 1.783 | 0.738 | 41.9% | +0.024 |
Log loss measures the probability assigned to the champion. Brier scores every team’s probability. Season averages receive equal weight; tied favorites split top-pick credit.
| Challenger minus frozen v1 | Δ title log loss | 95% season-bootstrap interval |
|---|---|---|
| Strength + calibration | +0.028 | [-0.002, +0.063] |
| Strength + uncertainty | -0.012 | [-0.067, +0.032] |
| Uncertainty + calibration | +0.024 | [-0.019, +0.067] |
Negative differences favor the challenger. An interval crossing zero leaves the direction uncertain. Small differences across 31 championships are not evidence of a dependable trading edge.
Calibration
Temperature scaling: q_i = p_i^(1/T) / sum_j p_j^(1/T). T is fitted to earlier forward-season forecasts only, with a prior toward 1; no target outcome participates. Calibration changes confidence, not ranking.
A temperature above 1 spreads probability across more contenders; below 1 concentrates it. A fitted calibration layer can worsen future forecasts, so it must earn its place in the backtest.
Strength uncertainty
Empirical-Bayes Gaussian rating uncertainty from regular-season residuals and ridge covariance. One correlated strength vector persists through every postseason game. 1,024 scrambled Sobol draws integrate exact conditional brackets.
The bracket is evaluated for each shared strength draw, then averaged. Averaging individual game probabilities first would discard the connection between a team’s games.
Inspect the probabilities
Frozen 2026-04-12 · Game model trained through 2025
Eventual champion · label only
New York Knicks
Champion’s forecast probability
4.0%
Strength + uncertainty · title log loss
3.215
Thin line: 95% range. Thick line: 80% range. Marker: mean title probability. All bands use a common 0–100% scale. Probabilities sum to 100% before rounding; interval endpoints do not.
What these intervals mean: variation in the model’s title probability as team ratings vary. They omit game-coefficient, calibration, roster, injury, and model-error uncertainty. Their coverage for the true probability is unverified; they are not a safe staking threshold.
| Team | Mean title probability | 80% range | 95% range | Rating SD · pts/game |
|---|---|---|---|---|
Oklahoma City Thunder | 52.0% | 28.9%–74.1% | 18.2%–81.3% | 1.44 |
San Antonio Spurs | 15.4% | 3.8%–31.0% | 1.6%–44.5% | 1.44 |
Detroit Pistons | 13.0% | 2.9%–26.9% | 1.2%–38.3% | 1.44 |
Boston Celtics | 10.6% | 2.1%–22.9% | 0.9%–34.3% | 1.44 |
New York Knicks Eventual champion | 4.0% | 0.4%–9.4% | 0.1%–16.8% | 1.44 |
Denver Nuggets | 1.5% | <0.1%–3.8% | <0.1%–7.9% | 1.44 |
Houston Rockets | 1.2% | <0.1%–3.2% | <0.1%–6.7% | 1.44 |
Cleveland Cavaliers | 0.8% | <0.1%–2.0% | <0.1%–4.8% | 1.44 |
Charlotte Hornets | 0.5% | <0.1%–1.1% | <0.1%–3.5% | 1.44 |
Toronto Raptors | 0.3% | <0.1%–0.7% | <0.1%–1.8% | 1.44 |
Minnesota Timberwolves | 0.2% | <0.1%–0.7% | <0.1%–1.6% | 1.44 |
Atlanta Hawks | 0.2% | <0.1%–0.4% | <0.1%–1.2% | 1.44 |
Los Angeles Lakers | <0.1% | <0.1%–0.2% | <0.1%–0.6% | 1.44 |
Phoenix Suns | <0.1% | <0.1%–0.1% | <0.1%–0.4% | 1.44 |
Miami Heat | <0.1% | <0.1%–<0.1% | <0.1%–0.3% | 1.44 |
Orlando Magic | <0.1% | <0.1%–<0.1% | <0.1%–0.2% | 1.44 |
Philadelphia 76ers | <0.1% | <0.1%–<0.1% | <0.1%–<0.1% | 1.44 |
LA Clippers | <0.1% | <0.1%–<0.1% | <0.1%–0.1% | 1.44 |
Portland Trail Blazers | <0.1% | <0.1%–<0.1% | <0.1%–<0.1% | 1.44 |
Golden State Warriors | <0.1% | <0.1%–<0.1% | <0.1%–<0.1% | 1.44 |
| Season | Champion | Frozen v1 | Calibrated | Uncertain strength | Uncertain + calibrated | Δ uncertainty vs v1 |
|---|---|---|---|---|---|---|
| NYK | 3.568 | 3.402 | 3.215 | 3.275 | -0.353 | |
| OKC | 0.307 | 0.362 | 0.403 | 0.391 | +0.096 | |
| BOS | 0.289 | 0.368 | 0.396 | 0.397 | +0.107 | |
| DEN | 2.448 | 2.407 | 2.452 | 2.454 | +0.003 | |
| GSW | 2.349 | 2.305 | 2.269 | 2.273 | -0.081 | |
| MIL | 2.333 | 2.282 | 2.259 | 2.272 | -0.074 | |
| TOR | 1.985 | 1.964 | 1.984 | 1.991 | -0.001 | |
| GSW | 2.287 | 2.247 | 2.198 | 2.233 | -0.089 | |
| GSW | 0.260 | 0.308 | 0.335 | 0.311 | +0.075 | |
| CLE | 2.636 | 2.597 | 2.588 | 2.688 | -0.048 | |
| GSW | 0.420 | 0.472 | 0.518 | 0.475 | +0.098 | |
| SAS | 0.965 | 1.042 | 1.065 | 1.052 | +0.100 | |
| MIA | 1.015 | 1.069 | 1.101 | 1.103 | +0.086 | |
| MIA | 2.149 | 2.108 | 2.108 | 2.111 | -0.041 | |
| DAL | 3.174 | 3.113 | 3.047 | 3.100 | -0.127 | |
| LAL | 2.596 | 2.579 | 2.557 | 2.594 | -0.039 | |
| LAL | 1.494 | 1.494 | 1.544 | 1.542 | +0.050 | |
| BOS | 0.506 | 0.568 | 0.604 | 0.575 | +0.098 | |
| SAS | 1.279 | 1.319 | 1.301 | 1.297 | +0.023 | |
| MIA | 2.886 | 2.841 | 2.781 | 2.839 | -0.104 | |
| SAS | 1.008 | 1.046 | 1.071 | 1.055 | +0.063 | |
| DET | 1.962 | 1.955 | 1.961 | 1.963 | -0.001 | |
| SAS | 1.636 | 1.653 | 1.685 | 1.681 | +0.049 | |
| LAL | 1.464 | 1.503 | 1.495 | 1.497 | +0.031 | |
| LAL | 3.257 | 3.222 | 3.141 | 3.222 | -0.116 | |
| LAL | 0.868 | 0.958 | 0.945 | 0.944 | +0.077 | |
| SAS | 0.929 | 1.084 | 1.052 | 1.120 | +0.123 | |
| CHI | 1.266 | 1.410 | 1.342 | 1.423 | +0.076 | |
| CHI | 0.598 | 0.829 | 0.661 | 0.823 | +0.063 | |
| CHI | 0.353 | 0.668 | 0.406 | 0.653 | +0.053 | |
| HOU | 6.246 | 6.227 | 5.669 | 5.928 | -0.576 |
Feature experiment · 14 refitted variants
The answer depends on whether we score playoff games or championships. Every variant was retrained and selected using earlier seasons; the comparisons below do not rank raw coefficient sizes.
Removing strength from v1 leaves home court only. Title log loss increases by +0.698, with a 95% season interval [+0.275, +1.086].
Removing the venue effect from v1 increases game log loss by +0.030, with interval [+0.018, +0.043]. The championship-loss difference remains uncertain.
| Feature removed | Δ title log loss | 95% season interval | Δ game log loss | 95% game-loss interval |
|---|---|---|---|---|
| Opponent-adjusted scoring margin | +0.057 | [+0.001, +0.120] | +0.001 | [-0.001, +0.003] |
| Conference seed / pre-play-in rank | +0.005 | [-0.029, +0.046] | +0.000 | [-0.001, +0.002] |
| Home court | -0.019 | [-0.071, +0.028] | +0.029 | [+0.017, +0.042] |
| Regular-season win percentage | -0.019 | [-0.109, +0.063] | +0.001 | [-0.002, +0.003] |
| Last-20-game performance residual | -0.029 | [-0.068, +0.009] | -0.000 | [-0.001, +0.000] |
Strength, record, and seed overlap. These are conditional contributions within this specific model, not causal effects or a universal feature ranking. The full model itself did not outperform v1 on title loss.
Adding seed produced only a small, uncertain title-loss improvement. Record and the tested last-20-game residual did not establish added title value. The apparent strength contribution in the full model also has a three-season-block interval crossing zero.
Not tested here: offensive rating, defensive rating, pace, three-point volume, turnovers, rebounds, injuries, players, or betting prices. The long-term site statistics are not a substitute for verified historical features at each forecast cutoff.
| Refitted variant | Title log loss | Game log loss | Title Brier |
|---|---|---|---|
| Home court only | 2.457 | 0.661 | 0.894 |
| Strength only | 1.768 | 0.652 | 0.724 |
| Strength + home (current v1) | 1.759 | 0.622 | 0.727 |
| Raw margin + home | 1.774 | 0.623 | 0.729 |
| Record + home (record baseline) | 1.832 | 0.620 | 0.750 |
| Strength + home + record | 1.774 | 0.619 | 0.735 |
| Strength + home + seed | 1.746 | 0.619 | 0.735 |
| Strength + home + recent form | 1.784 | 0.623 | 0.733 |
| All five feature groups | 1.797 | 0.619 | 0.741 |
| All except opponent-adjusted scoring margin | 1.854 | 0.620 | 0.759 |
| All except home court | 1.778 | 0.649 | 0.737 |
| All except regular-season win percentage | 1.778 | 0.620 | 0.741 |
| All except conference seed / pre-play-in rank | 1.802 | 0.620 | 0.740 |
| All except last-20-game performance residual | 1.768 | 0.619 | 0.736 |
Each feature variant is refitted on earlier playoff games; its logistic C is selected using only earlier forward-season title log losses. Training-only RMS scaling; no free intercept; signed home indicator is unscaled.
Mean scoring-margin residual in each team's last 20 regular games, after subtracting the full-season adjusted strength difference and estimated home effect.
Negative conference seed before 2020; negative regular-season conference rank before play-in from 2021. Bracket positions remain fixed across variants, including variants omitting seed as a game-model feature.
Title metrics are averaged equally across seasons. Game metrics first average playoff games within each season, then average seasons equally; every game uses frozen regular-season-end features, including later rounds.
A positive drop-one-minus-full loss difference means removing that feature hurt the full model. Contributions are conditional on the other correlated features and are not causal effects. Addition-minus-v1 differences favor the addition when negative.
Fourteen prespecified comparisons reuse already-inspected historical seasons; these are exploratory follow-up results, not a fresh untouched holdout. Confidence intervals are descriptive and not multiplicity-adjusted.
Only score-derived signals are tested. Possession-adjusted offense/defense, shooting, turnovers, injuries, players, and market prices cannot be ranked from these inputs.
Strength, record, and seed are strongly related. A small drop-one effect does not show that a feature lacks standalone information.
Home-court ablation removes the learned venue effect but retains actual seeding, bracket structure, and regular-season home correction used to estimate strength.
Raw margin versus adjusted strength compares the full rating construction, including home/schedule adjustment and fixed shrinkage, rather than isolating schedule adjustment alone.
The same regular-season-end cutoff and exclusion of 2020 apply to every variant. No target postseason scores are feature inputs.
Separate experiment · In-season title forecasts
This first in-season benchmark maps pre-cutoff team strength and record directly to title probabilities for every team. It does not simulate the remaining schedule, qualification, or bracket. Each checkpoint gets its own chronological backtest.
| Cutoff | Test seasons | Equal chances · all teams | Record softmax | Strength softmax | Strength + record softmax |
|---|---|---|---|---|---|
| January 1 | 30 | 3.389 | 2.111 | 2.125 | 2.056 |
| February 1 | 30 | 3.389 | 2.094 | 1.991 | 2.008 |
| March 1 | 31 | 3.388 | 2.138 | 1.921 | 2.041 |
January and February omit the 1999 lockout season because teams had not played at the cutoff. All checkpoints exclude 2020. Repeated checkpoints do not create additional independent champions. Strength-based improvements over record remain uncertain.
Only games before 2026-03-01 enter this snapshot. Trained through 2025; eventual champion NYK received 4.3%. This is a historical reconstruction, not a live forecast.
| Team | Record at cutoff | Title probability |
|---|---|---|
| Oklahoma City Thunder | 46–15 | 51.7% |
| Detroit Pistons | 44–14 | 9.8% |
| Boston Celtics | 39–20 | 7.9% |
| San Antonio Spurs | 43–16 | 7.7% |
| New York KnicksEventual champion | 38–22 | 4.3% |
| Houston Rockets | 37–22 | 3.8% |
| Cleveland Cavaliers | 37–24 | 2.7% |
| Denver Nuggets | 37–23 | 2.6% |
| Minnesota Timberwolves | 37–23 | 2.0% |
| Miami Heat | 32–29 | 1.5% |
| Charlotte Hornets | 30–31 | 1.2% |
| Toronto Raptors | 35–25 | 0.8% |
| Golden State Warriors | 31–29 | 0.8% |
| Phoenix Suns | 34–26 | 0.6% |
| Orlando Magic | 31–27 | 0.5% |
| Philadelphia 76ers | 33–26 | 0.5% |
| Los Angeles Lakers | 35–24 | 0.4% |
| LA Clippers | 27–31 | 0.4% |
| Atlanta Hawks | 30–31 | 0.3% |
| Portland Trail Blazers | 29–32 | 0.2% |
| Memphis Grizzlies | 22–36 | 0.1% |
| Milwaukee Bucks | 26–32 | <0.1% |
| Dallas Mavericks | 21–38 | <0.1% |
| Chicago Bulls | 24–36 | <0.1% |
| New Orleans Pelicans | 19–42 | <0.1% |
| Utah Jazz | 18–42 | <0.1% |
| Indiana Pacers | 15–45 | <0.1% |
| Brooklyn Nets | 15–44 | <0.1% |
| Sacramento Kings | 14–47 | <0.1% |
| Washington Wizards | 16–43 | <0.1% |
| Model | Δ title loss | 95% season interval |
|---|---|---|
| Equal chances · all teams | +1.250 | [+0.700, +1.695] |
| Strength softmax | -0.217 | [-0.587, +0.097] |
| Strength + record softmax | -0.097 | [-0.215, +0.024] |
Market data · research scope
Kalshi and Polymarket have discoverable 2027 championship markets. These historical forecasts end in 2026 and cannot be compared with a 2027 contract to calculate expected value. A current forecast, executable price, fees, and market-data permissions still need to be connected and validated.
FanDuel and DraftKings acquisition remains an adapter proposal through a data provider; historical futures coverage and access have not been verified. No live expected-value ranking, staking rule, or automated trading is enabled.
Generated 2026-11-10T14:17:21.943434+00:00 · Schema 1
Download full experiment JSON ↗Frozen v1 archive · The Experiments tab contains the calibration, uncertainty, feature, and in-season comparisons.
Historical backtest · Model v1
Four models were evaluated one season at a time using only earlier seasons for fitting and model selection. These are retrospective reconstructions, not forecasts published at the time or current-season title odds.
31
forward test seasons
1995–2026
season end years tested
51,507
source games across all phases
1985–2026
source season coverage
Cutoff: Regular-season end · before play-in. Historical reconstruction using final regular-season scores and seeds. Play-in outcomes are integrated, not supplied. Dates have day-level precision.
Average across 31 seasons. Lower probability loss is better.
| Model | Title log loss ↓ | Brier score ↓ | Top-pick accuracy |
|---|---|---|---|
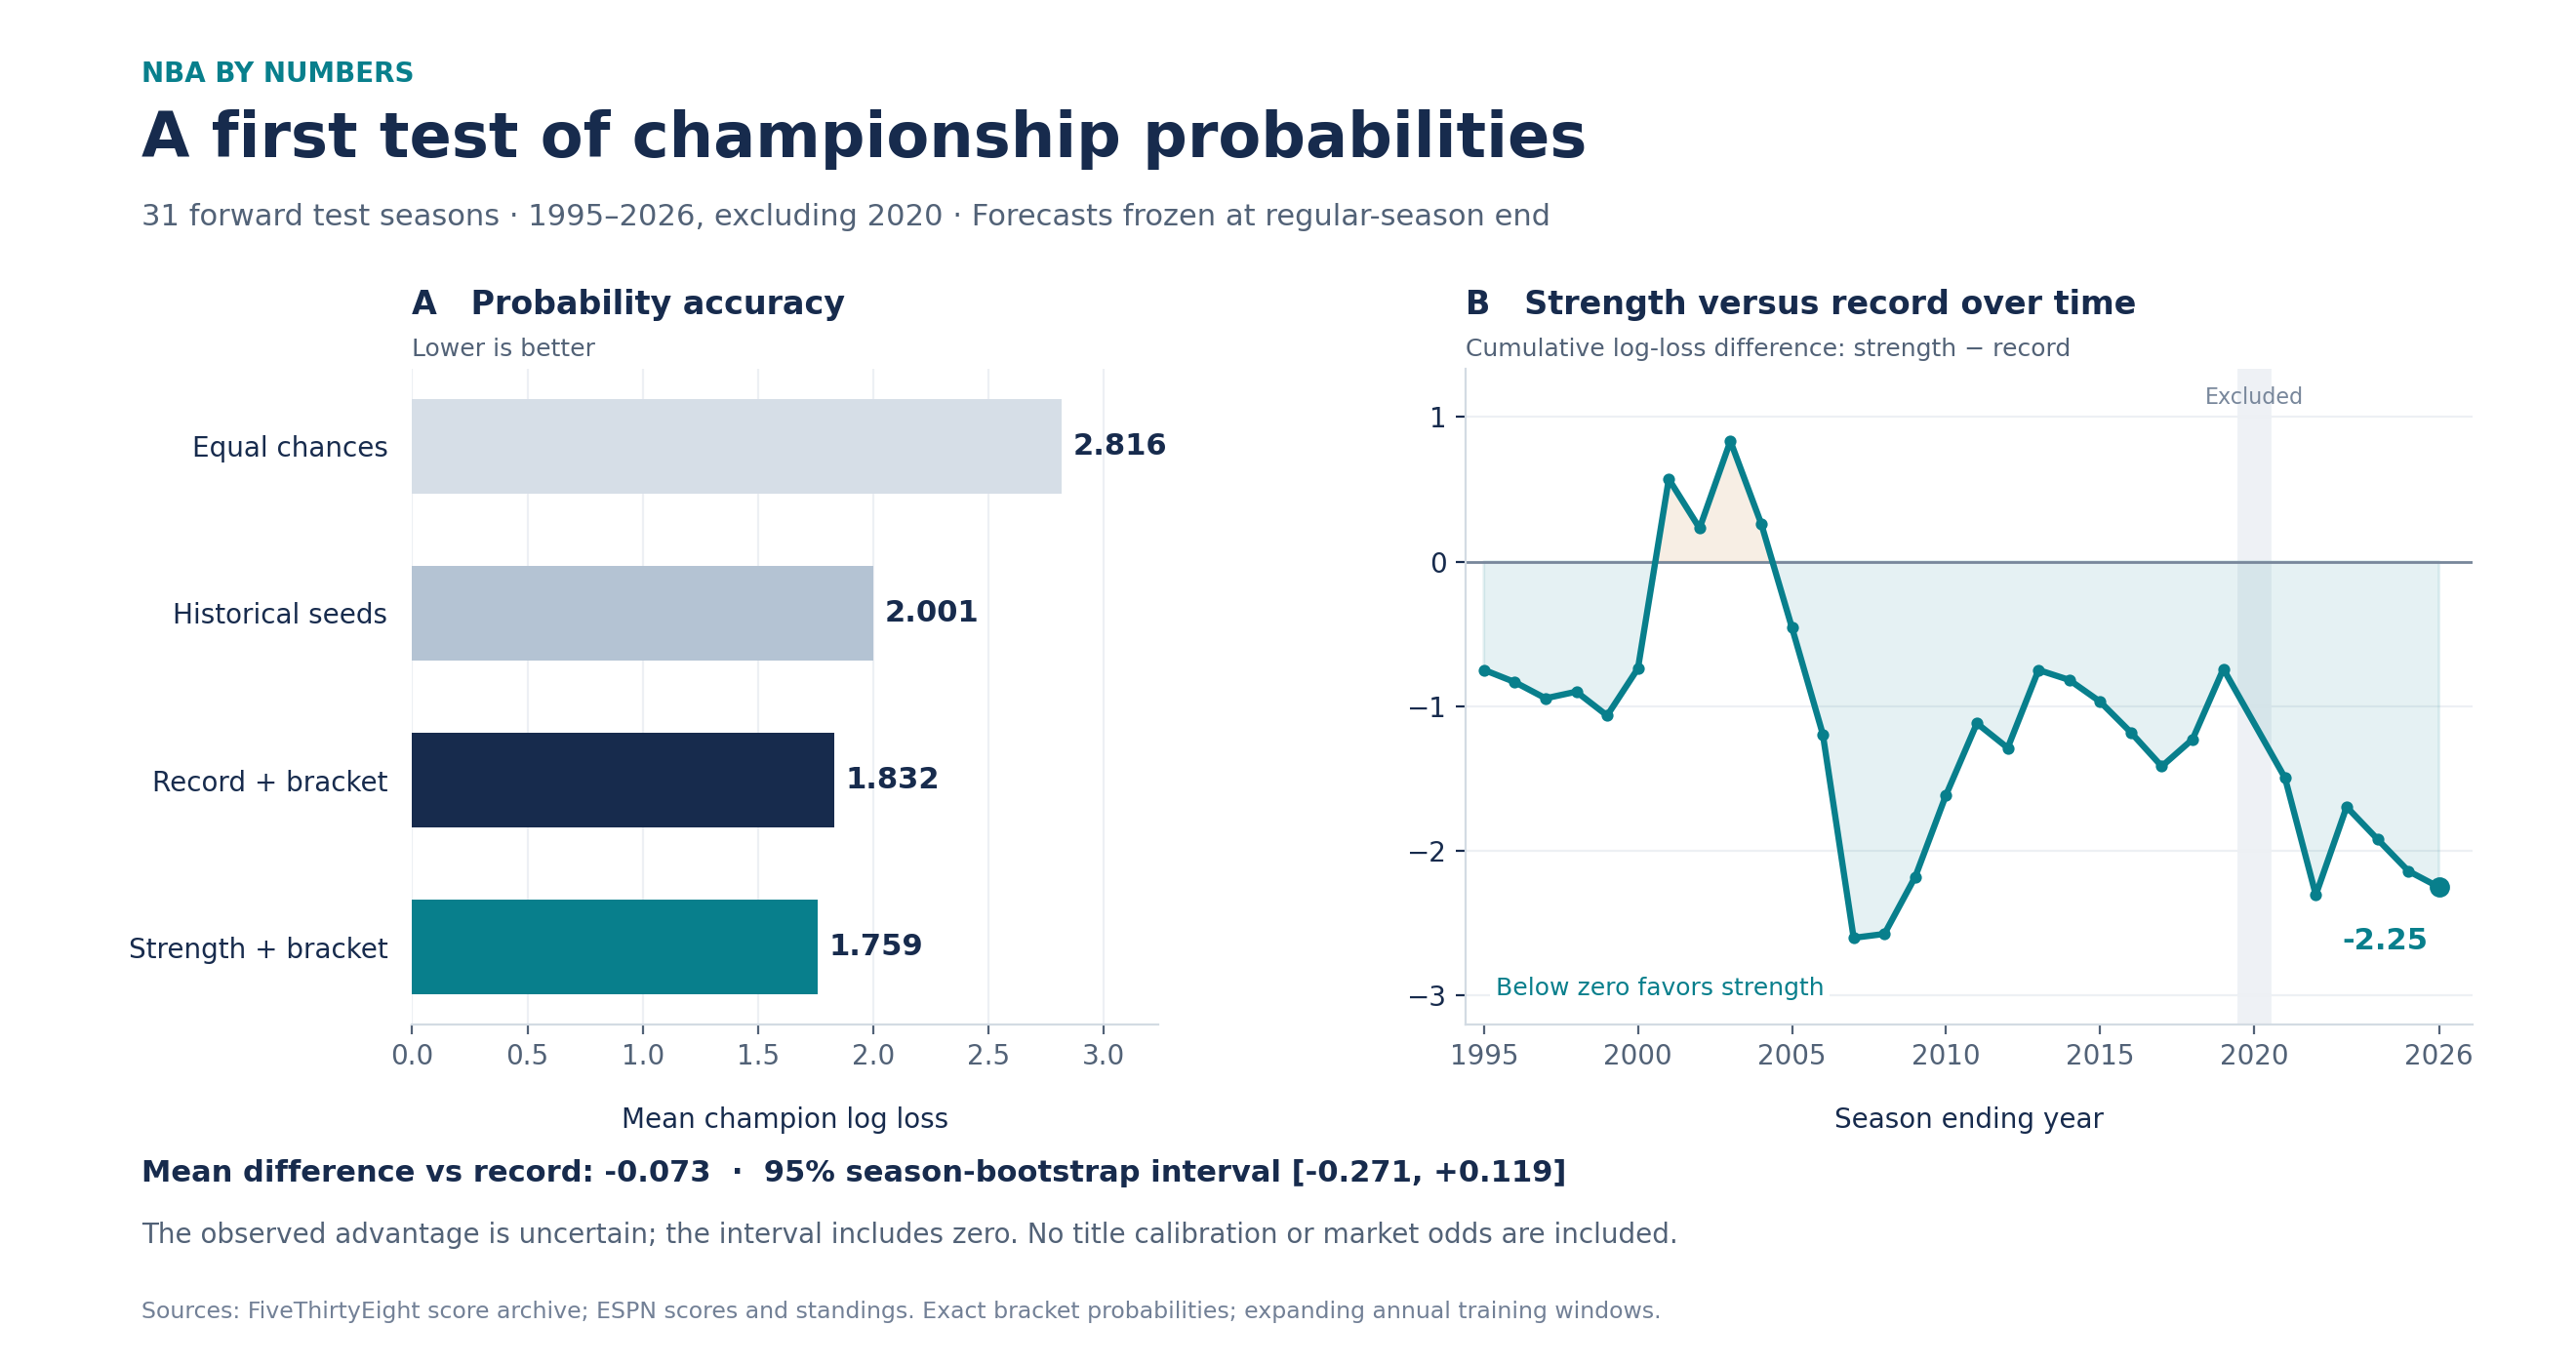
Equal chances Every eligible team has the same title probability: 1/16 historically, 1/20 in play-in seasons. | 2.816 | 0.940 | 6.0% |
Historical seeds Earlier champions' conference seed frequencies, with 0.5 pseudocount per rank, normalized across the current field. | 2.001 | 0.824 | 27.4% |
Record + bracket Same trained game model and exact bracket, using regular-season win percentage instead of adjusted scoring margin. | 1.832 | 0.750 | 41.9% |
Strength + bracket Opponent-adjusted regular-season scoring margin, a game model fitted only on earlier playoffs, and exact bracket probabilities. Lowest observed log loss | 1.759 | 0.727 | 38.7% |
Log loss penalizes assigning too little probability to the champion. Brier score sums squared probability errors across teams. Top-pick accuracy splits credit among tied favorites.
The advantage over record alone is uncertain. Across all 31 test seasons, strength minus record log loss is -0.073; the 95% season-bootstrap interval is [-0.271, +0.119]. It crosses zero. Lower observed loss does not establish reliable superiority.
Inspect a historical forecast
Frozen at 2026-04-12 · Trained on 1985–2025
Eventual champion · scoring label only
New York Knicks
Champion’s forecast probability
2.8%
Strength + bracket · season log loss
3.568
20 eligible teams · Probability sum 100.0%
| Team | Record | Title probability |
|---|---|---|
Oklahoma City Thunder West · Conference rank 1 | 64–18 | 57.9% |
San Antonio Spurs West · Conference rank 2 | 62–20 | 14.8% |
Detroit Pistons East · Conference rank 1 | 60–22 | 12.5% |
Boston Celtics East · Conference rank 2 | 56–26 | 9.6% |
New York KnicksEventual champion East · Conference rank 3 | 53–29 | 2.8% |
Denver Nuggets West · Conference rank 3 | 54–28 | 0.8% |
Houston Rockets West · Conference rank 5 | 52–30 | 0.7% |
Cleveland Cavaliers East · Conference rank 4 | 52–30 | 0.4% |
Charlotte Hornets East · Conference rank 9 | 44–38 | 0.2% |
Toronto Raptors East · Conference rank 5 | 46–36 | 0.1% |
Minnesota Timberwolves West · Conference rank 6 | 49–33 | <0.1% |
Atlanta Hawks East · Conference rank 6 | 46–36 | <0.1% |
Los Angeles Lakers West · Conference rank 4 | 53–29 | <0.1% |
Phoenix Suns West · Conference rank 7 | 45–37 | <0.1% |
Miami Heat East · Conference rank 10 | 43–39 | <0.1% |
Orlando Magic East · Conference rank 8 | 45–37 | <0.1% |
LA Clippers West · Conference rank 9 | 42–40 | <0.1% |
Philadelphia 76ers East · Conference rank 7 | 45–37 | <0.1% |
Portland Trail Blazers West · Conference rank 8 | 42–40 | <0.1% |
Golden State Warriors West · Conference rank 10 | 37–45 | <0.1% |
Bars use a common 0–100% scale. Probabilities sum to 100% before display rounding. Play-in candidates retain their chance of advancing; eliminated teams receive zero.
Outer training seasons: 1985–2025. 3,128 earlier playoff games are available to the fitted game models. The target season’s playoff outcomes are used only to score predictions.
Each year, choose logistic C from 0.1, 1, 10 using mean title log loss from earlier forward-season predictions (minimum five training seasons per inner fold). Scaling is learned only from the training games. No outer-season result participates in its selection.
| Season | Champion | Strength p(champion) | Strength log loss | Record log loss | Strength − record | Train through |
|---|---|---|---|---|---|---|
| NYK | 2.8% | 3.568 | 3.680 | -0.112 | 2025 | |
| OKC | 73.5% | 0.307 | 0.528 | -0.220 | 2024 | |
| BOS | 74.9% | 0.289 | 0.513 | -0.223 | 2023 | |
| DEN | 8.6% | 2.448 | 1.839 | +0.610 | 2022 | |
| GSW | 9.5% | 2.349 | 3.160 | -0.810 | 2021 | |
| MIL | 9.7% | 2.333 | 3.087 | -0.755 | 2019 | |
| TOR | 13.7% | 1.985 | 1.498 | +0.487 | 2018 | |
| GSW | 10.2% | 2.287 | 2.099 | +0.188 | 2017 | |
| GSW | 77.1% | 0.260 | 0.495 | -0.235 | 2016 | |
| CLE | 7.2% | 2.636 | 2.849 | -0.213 | 2015 | |
| GSW | 65.7% | 0.420 | 0.571 | -0.151 | 2014 | |
| SAS | 38.1% | 0.965 | 1.035 | -0.069 | 2013 | |
| MIA | 36.2% | 1.015 | 0.475 | +0.539 | 2012 | |
| MIA | 11.7% | 2.149 | 2.319 | -0.170 | 2011 | |
| DAL | 4.2% | 3.174 | 2.679 | +0.496 | 2010 | |
| LAL | 7.5% | 2.596 | 2.029 | +0.567 | 2009 | |
| LAL | 22.4% | 1.494 | 1.098 | +0.396 | 2008 | |
| BOS | 60.3% | 0.506 | 0.479 | +0.027 | 2007 | |
| SAS | 27.8% | 1.279 | 2.688 | -1.410 | 2006 | |
| MIA | 5.6% | 2.886 | 3.623 | -0.737 | 2005 | |
| SAS | 36.5% | 1.008 | 1.729 | -0.721 | 2004 | |
| DET | 14.1% | 1.962 | 2.534 | -0.572 | 2003 | |
| SAS | 19.5% | 1.636 | 1.032 | +0.604 | 2002 | |
| LAL | 23.1% | 1.464 | 1.804 | -0.340 | 2001 | |
| LAL | 3.9% | 3.257 | 1.946 | +1.311 | 2000 | |
| LAL | 42.0% | 0.868 | 0.542 | +0.327 | 1999 | |
| SAS | 39.5% | 0.929 | 1.095 | -0.165 | 1998 | |
| CHI | 28.2% | 1.266 | 1.220 | +0.046 | 1997 | |
| CHI | 55.0% | 0.598 | 0.711 | -0.112 | 1996 | |
| CHI | 70.3% | 0.353 | 0.437 | -0.085 | 1995 | |
| HOU | 0.2% | 6.246 | 6.996 | -0.750 | 1994 |
Expanding annual windows: at least 10 earlier seasons for each outer forecast. Game coefficients use earlier playoff outcomes paired with those years' frozen regular-season features. All probabilities sum to 100% before rounding.
Logistic game probabilities are fitted; no separate title calibration is claimed. Probability reliability bins and season-level uncertainty are reported as diagnostics. Top-pick accuracy gives fractional credit when favorites tie.
| Baseline | Δ log loss | 95% season bootstrap | 95% 3-season blocks |
|---|---|---|---|
| Equal chances | -1.057 | [-1.475, -0.583] | [-1.435, -0.643] |
| Historical seeds | -0.242 | [-0.617, +0.121] | [-0.553, +0.070] |
| Record + bracket | -0.073 | [-0.271, +0.119] | [-0.292, +0.134] |
Negative differences favor strength + bracket. Resampling keeps teams from each season together.
| Predicted range | Team-seasons | Mean probability | Observed win rate |
|---|---|---|---|
| 0.0%–1.0% | 284 | 0.2% | 0.4% |
| 1.0%–5.0% | 103 | 2.5% | 2.9% |
| 5.0%–10.0% | 39 | 7.1% | 15.4% |
| 10.0%–20.0% | 46 | 13.9% | 10.9% |
| 20.0%–40.0% | 33 | 30.4% | 24.2% |
| 40.0%–60.0% | 9 | 48.8% | 22.2% |
| 60.0%–100.0% | 6 | 70.3% | 100.0% |
These are diagnostic bins, not independent trials: each season has one champion. High-probability bins are small, and no title-level recalibration has been fitted.
Generated 2026-11-10T13:56:49.766597+00:00 · Schema 1
The forecast contract
The backtest above reconstructs the end of each regular season. These controls explain different forecast definitions; they do not change the fitted results or produce a live forecast.
Current format: 20 teams are still eligible. Model the play-in; do not substitute its eventual winners. Historical seasons use their own eligibility rules.
01
Use only games, rosters, and injury news known at the cutoff.
02
Estimate strengths, home court, and series win probabilities.
03
Include play-in uncertainty when the field is not yet final.
Original site dataset
76
seasons
1,663
team-seasons
1950–2025
season end years
This original dataset powers the site’s historical statistics. The championship backtest uses a separate, sourced game-and-seed dataset covering 1985–2026; its results and provenance are reported above.
01 · First model · Backtested
The first fitted model uses opponent-adjusted scoring margin per game and home court. Earlier playoff games train the logistic matchup link; exact series and bracket calculations produce title probabilities, including play-in uncertainty.
Dated scores, regular-season records and seeds, historical playoff formats, and home-court rules. No possessions, injuries, roster changes, recent-form feature, or odds enter this version.
In the original four-model comparison, strength has the lowest observed loss, but its paired uncertainty interval against record + bracket crosses zero. The Experiments tab compares calibration, strength uncertainty, and additional features with this frozen version.
After the playoff model works
Keep the validated playoff engine. Add time-varying team strength, early-season shrinkage, roster changes, and simulation of the remaining schedule. Seed and opponent uncertainty are part of the probability.
01
Shrink early results toward prior-season and roster priors.
02
Simulate all remaining games, standings, and tiebreakers.
03
Simulate play-in, seeding, each series, and the Finals.
Start weekly. Move to daily updates only after the data pipeline and probability calibration hold up at each point in the season.
A test that respects time
Random team-row splits leak shared season information. Use an expanding window, keep each season intact, and fit feature scaling, missing-value handling, model selection, and probability calibration only on earlier data.
| Outer fold | Fit and tune inside | Untouched prediction |
|---|---|---|
| 1 | 1985–1994 | 1995 |
| 2 | 1985–1995 | 1996 |
| 3 | 1985–1996 | 1997 |
| … | Expand one season at a time | Next season |
The original v1 uses earlier forward predictions to select logistic C from 0.1, 1, and 10. The new calibration experiment fits temperature only to earlier forward forecasts; the original v1 remains frozen. New experiments reuse previously inspected seasons, so they are exploratory comparisons rather than fresh holdouts. Source data is reconstructed retrospectively, not a publication-vintage or prospective test.
Use multiclass title log loss and season-level Brier score. Check reliability: teams forecast near 20% should win about 20% over enough independent seasons. Top-pick accuracy is secondary.
Compare models on identical held-out seasons. Bootstrap whole seasons for paired loss differences. Report modern-era sensitivity, lockout/bubble seasons, missing-data coverage, and calibration uncertainty.
Keep every weekly snapshot from a season in the same outer fold. Report results by week or games played; average within each season before averaging across seasons. More snapshots do not create more champions.
Store the forecast time, source publication time, retrieval time, feature version, model version, and training seasons with every prediction. Playoff outcomes are labels only. Later injury reports, eventual play-in winners, and closing odds cannot enter an earlier forecast.
References: time-ordered validation · probability calibration
Model versus markets
Compare our 2026–27 championship probabilities with available provider prices. EV shows expected dollar profit on a hypothetical $100 investment. Add your own fair prices below for a separate comparison against the same provider quotes.
The forecast is All verified feature groups. Its inputs are dated to the forecast cutoff; feature coverage varies by model. Indicative prices are not verified executable orders; unknown fees are excluded and results are labeled before fees.
Highest expected profit / $100
—
Loading provider prices…
Completed games dated through 2026-11-09
Source metadata update times appear below.
Default chosen by lowest title log loss across 9 shared November 10 test seasons; this selection is exploratory. The observed winner is not proof of a dependable advantage. Selected model: All verified feature groups · title log loss 1.862.
Refreshing prices does not update the published model forecast. Quotes before the model cutoff, from another season, or past their freshness limit are excluded. Metadata update times do not establish order-book freshness.
Expected profit for $100 invested using our forecast. Highest EV is shown first by default; click a column heading to sort. Manual entries do not change model EV.
| Team / outcome | Provider | Price metadata updated · Eastern | ||||
|---|---|---|---|---|---|---|
| No comparable quotes are available for this selection. | ||||||
A +$50 EV means $50 expected profit on $100 invested, excluding the returned investment. Before-fee rows omit unknown charges. This scales the quoted price linearly; available size, minimum orders, and fee rounding at $100 are not verified. This ranking is not a portfolio allocation.
Your optional comparison
Enter what you think a $1 championship YES contract is worth. A fair price of 20¢ means a 20% chance of winning. We compare that reference with the provider prices above; our model predictions stay unchanged.
0 manual prices · 0.0% total
A partial field is allowed. Blank teams are omitted, not assigned zero; your inputs are not renormalized. Manual fair prices are a probability reference, not new executable provider quotes.
For a YES contract paying $1, expected return is (title chance − ask − fee) / (ask + fee). For NO, use 1 − title chance. Multiply return by $100 to obtain the displayed expected dollar profit. When fees are unknown, the estimate is before fees. Sportsbook return is title chance × decimal odds − 1. Provider-price sorting compares the cost of a $1 payout across quote types.
Prices and forecasts must refer to the same season and championship outcome. Available provider coverage is shown above; an unconnected provider has no inferred or simulated price.